Regents Recap — June 2015: Common Core Geometry Structure

Here is another installment in my series reviewing the NY State Regents exams in mathematics.

June, 2015 saw the administration of the first Common Core Geometry Regents exam in New York.  This exam will replace the Geometry Regents exam, which was also offered this testing cycle.

The CC Geometry exam has fewer multiple choice questions (24) than the Geometry exam (28).  It is worth noting that this change, in and of itself, likely will reduce average scores, as random guessing on those four extra questions would, on average, earn 2 points.  The free response sections are structured slightly differently, but not substantially so.  These differences mirror those between the new Common Core Algebra exam, introduced last year, and the old Integrated Algebra exam (see here).

The two Geometry exams are not drastically different, though there is greater emphasis on transformations on the CC Geometry exam, which I covered here.   However, there are some minor differences that have impact.

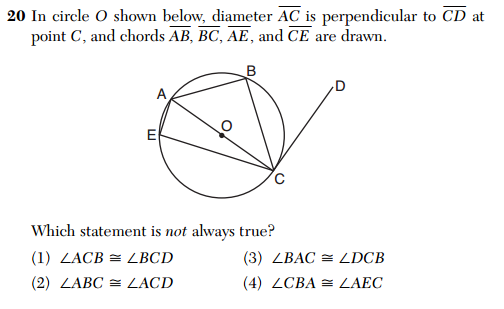
First, the multiple choice questions on the CC Geometry exam definitely seem a bit harder, on average, than those on the old Geometry exam.  One place this is apparent is the higher frequency of questions that ask the student to identify the false statement, rather than the true statement.  Here are two questions similar in content, one from each exam:  Question 20 from the CC exam (top) and Question 16 (bottom) from the non-CC exam.

2015 CC GEO 20

2015 GEO 16Generally speaking, I’d say it’s more challenging to identify a statement that is not always true than one which must be true.  There are three such problems on the CC exam, compared with one on the old exam.

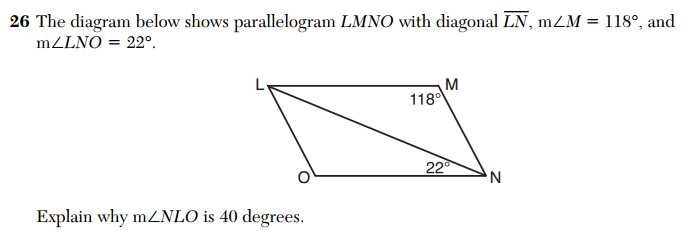
Question 26 on the CC exam exemplifies the increased emphasis on explaining one’s work.

2015 CC GEO 26

A more traditional question might simply ask for the measure of angle NLO.  Here, the measure of the angle is given, and the student is asked to provide the mathematical justification for that value.

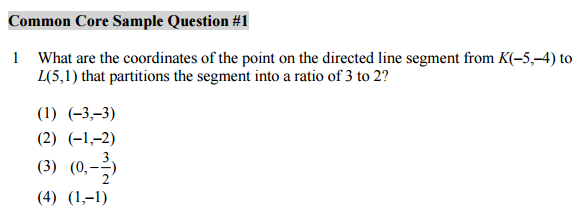
Lastly, our teacher team was somewhat surprised at how closely the exam tracked the sample items that were released by the state.  For example, the segment partitioning problem on the CC Geometry exam

2015 CC GEO 27

was very similar to a sample item

CC Sample Segment partitionAdditionally, the construction problem on the CC Geometry exam
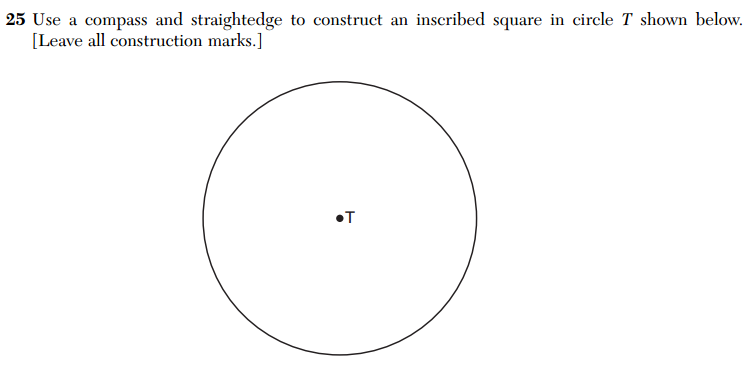
2015 CC GEO 25was identical to problem 12 in the Fall sample items.

Our Geometry teacher team generally found this inaugural CC Geometry exam to be in line with our expectations in terms of content and difficulty.  If anything, we were surprised at how unsurprising it was to us.

More the anything related to the Common Core exam, the level of difficulty of the old Geometry exam given during the same cycle surprised us.  The multiple choice section seemed to be more challenging than those of past recent exams, which made us wonder if the two exams drew their multiple choice questions from a single pool.
MOVES 2015

MOVES 2015I’m excited to once again be participating in the MOVES conference at the Museum of Mathematics!

MOVES, the Mathematics of Various Entertaining Subjects, is a biennial event run by MoMath that celebrates recreational mathematics.  This year, the conference will be headlined by John Conway, Elwyn Berlekamp, and Richard Guy, co-authors of Winning Ways for Your Mathematical Plays, a classic book on mathematical games.

I’ll be running a session on the Activity Track called Games on Graphs”, where we will explore some elementary graph theory through a few simple graph-based games.   Most importantly, we’ll talk about how to create new games that can further our mathematical investigations!

You can learn more about the conference here, and see the full program here.

Regents Recap — June 2015: Common Core Geometry and Transformations

Here is another installment in my series reviewing the NY State Regents exams in mathematics.

June, 2015, saw the administration of the first Common Core Geometry Regents exam in New York.  I led a teacher team that worked to adapt our curriculum to the Common Core standards.  One of our primary concerns was how the new transformation-based approach to Geometry inherent in the Common Core standards would be represented on this Regents exam.  In particular, we had no idea how establishing congruence and similarity via transformations, an apparent emphasis of the standards, would be assessed.

A total of 18 of the 86 points on the exam (around 21%) were associated with transformations:  six multiple choice questions and two free response questions.  Here are a few examples, with associated Common Core standards in parentheses.

Question 10 is about rotations that map regular polygons onto themselves (CCSS.MATH.CONTENT.HSG.CO.A.3).

2015 CC GEO 10

Question 16 assesses the concept that dilation can alter length but must preserve angle measure (CCSS.MATH.CONTENT.HSG.SRT.B.5).

2015 CC GEO 16

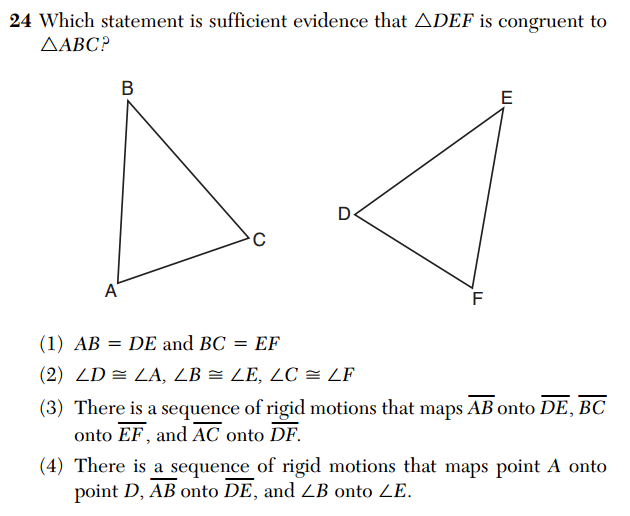
Question 24 addresses establishing congruence by rigid motions (CCSS.MATH.CONTENT.HSG.CO.B.7).

2015 CC GEO 24

Question 30 asks the student to explicitly connect transformations to congruence by recalling the fundamental principles that underlie rigid motions (CCSS.MATH.CONTENT.HSG.CO.B.6).

2015 CC GEO 30

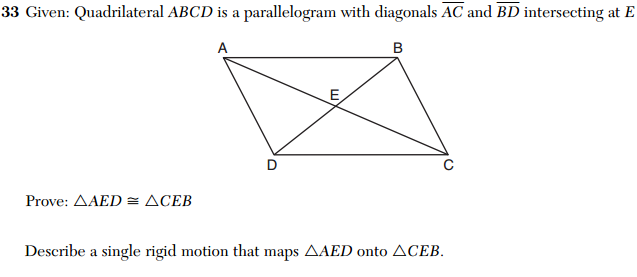
And Question 33 asks to student to first produce a “traditional” proof of congruence, and then interpret the congruence through a rigid motion (CCSS.MATH.CONTENT.HSG.CO.C.11).  This is a simple way to connect the two concepts.

2015 CC GEO 33

Overall, the manner in which transformations were tested aligned with our expectations, both in scope and in content.  Our Geometry worked closely together throughout the year, integrating a variety of resources from New York state and elsewhere, but mostly felt in the dark about what the test would look like.  In the end, we were pleasantly surprised.  But we also noticed how much different the Common Core Algebra exam was in year two, so we know that we may be surprised again.

Regents Recap — June 2015: Trouble with 3D Geometry

Here is another installment in my series reviewing the NY State Regents exams in mathematics.

The Common Core standards have brought a slight increase in three dimensional reasoning into high school Geometry.  I think this is generally a good thing:  3D geometry is typically given short shrift in this course, but is a beautiful and intriguing topic.

It can also be a confusing topic, as these problems from the inaugural Common Core Geometry Regents exam demonstrate.

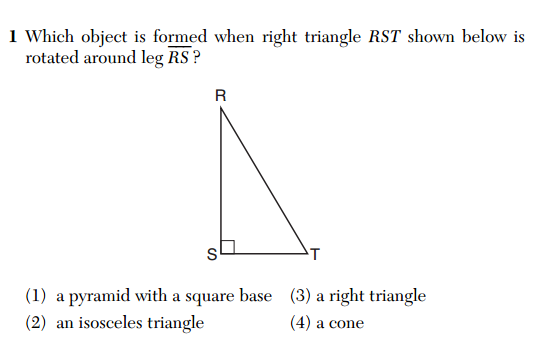
2015 CC GEO 1

According to the scoring guide, the correct answer is (4) a cone.  Technically, however, the correct answer is (3) a right triangle.

Rotation is a rigid motion:  it does not change a figure’s size or shape.  If a right triangle is rotated about an axis, it will remain a right triangle.  Presumably, the intent of this question is for the student to identify the solid of revolution formed by revolving the triangle about an axis.  But that is a different question than the one posed.  Ironically, the notion that rigid motions preserve size and shape is one of the fundamental principles in the transformation-based approach to geometry embodied by the Common Core standards.

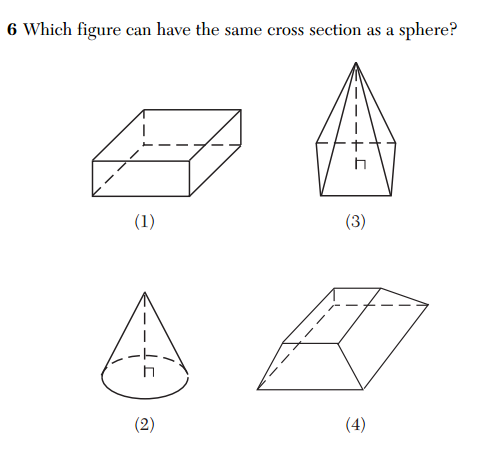
Here’s another problematic 3D geometry question.2015 CC GEO 6

According to the answer key, the correct answer is (2).  But the actual correct answer is all of these.  While most cross-sections of spheres are circles, some cross-sections of spheres are single points (when the cross-sectional plane is tangent to the sphere).  All the given objects have single point cross-sections as well, thus, could all have the same cross section as a sphere.

This is certainly not the first time we’ve seen problematic three dimensional geometry questions on these Regents exams (here’s a particularly embarrassing example), and I’ve been chronicling mathematically erroneous questions on these tests for years.  Errors like this are often dismissed as insignificant, or “typos”, but because of the high-stakes nature of these exams, these errors have real consequences for students and teachers.

If these exams don’t model exemplary mathematics and mathematical practice, their credibility in evaluating the mathematical practice of students and teachers must be questioned.

Regents Recap — June 2015: Cubics, Conversions, and Common Core

Here is another installment in my series reviewing the NY State Regents exams in mathematics.

One of the biggest differences between the new Common Core Regents exams and the old Regents exams in New York state are the conversion charts that turn raw scores into “scaled” scores.

The conversions for the new Common Core exams make it substantially more difficult for students to earn good scores.  The changes are particularly noticeable at the high end, where the notion of “Mastery” on New York’s state exams has been dramatically redefined.

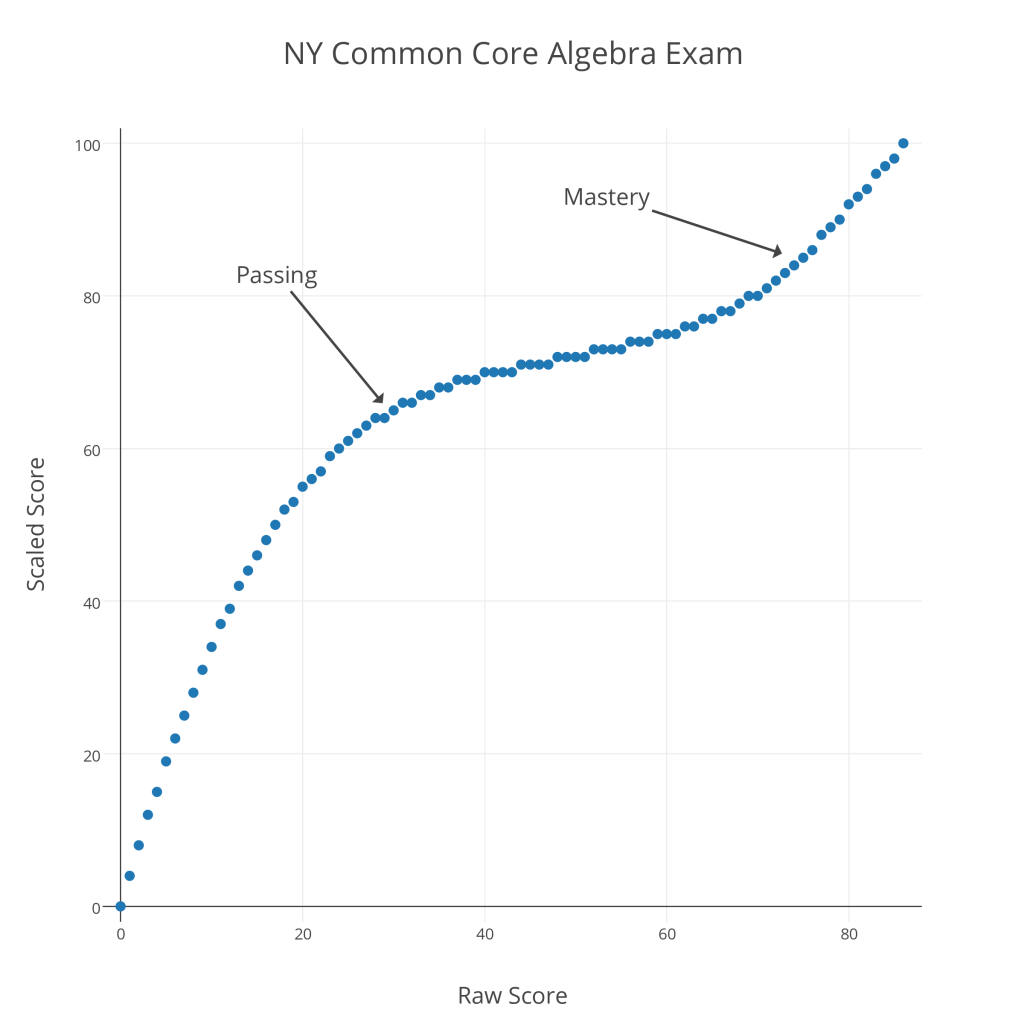
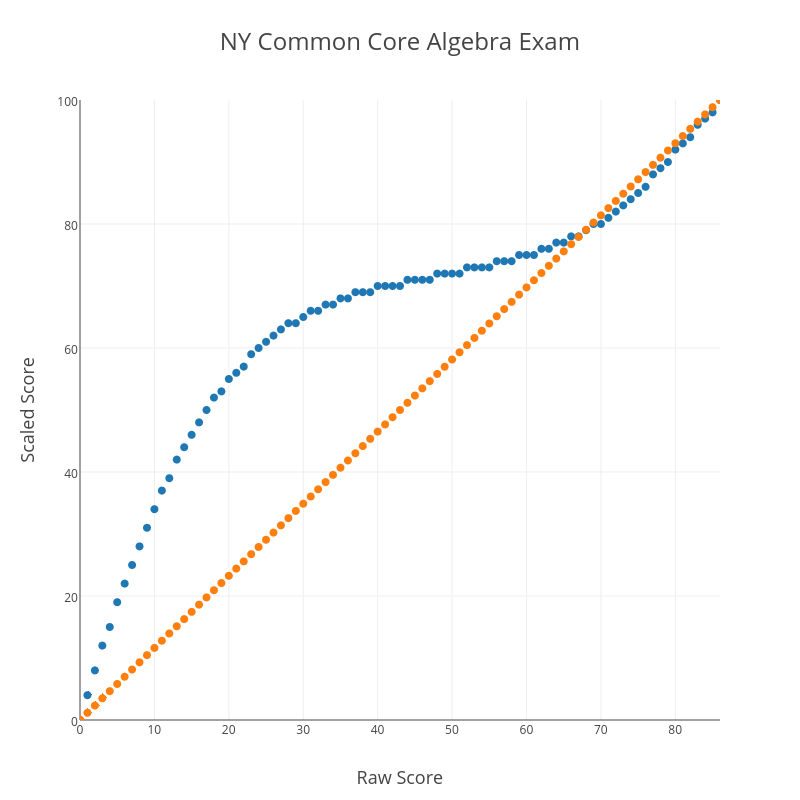
Below is a graph showing raw versus scaled scores for the 2015 Common Core Algebra Regents exam.

NY Common Core Algebra ExamAs with last year’s Common Core Algebra Regents exam, there is a remarkable contrast between “Passing” and “Mastery” scores.  To pass this exam (a 65 “scaled” score), a student must earn a raw score of 30 out of 86 (35%); to earn a “Mastery” score on this exam (an 85 “scaled” score), a student must earn a raw score of 75 out of 86 (87%).  It seems clear that the new conversions are designed to reduce the number of “Mastery” scores on these exams.

Another curious feature of this conversion chart is what happens at the upper end.  Consider the graph below, which shows the CC Algebra raw vs. scaled score in blue and a straight-percentage conversion (87% correct “scales” to an 87, for example) in orange.

NY Common Core Algebra Exam with Percentile

At the very high end, the blue conversion curve dips below the orange straight-percentage curve.  This means that, above a certain threshold, there is a negative curve for this exam!  For example, a student with a raw score of 82 has earned 95% of the available points, but actually receives a scaled score of less than 95 (a 94, in this case).  I suspect there are people who will claim expertise in these matters and argue that this makes sense for some reason, but it certainly doesn’t make common sense.

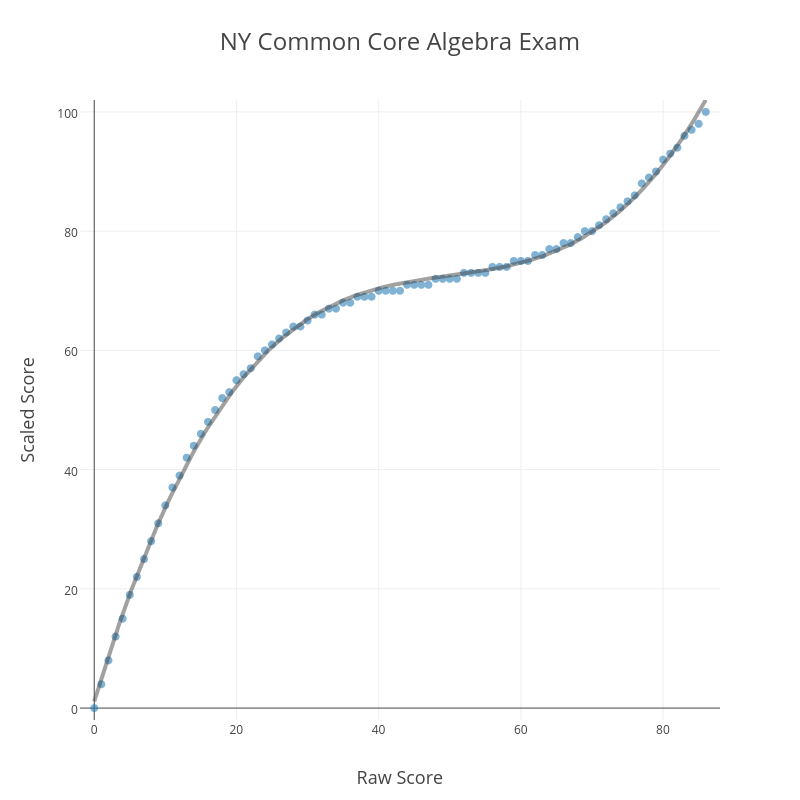
One final curiosity about this conversion.  It’s no accident that the blue plot of raw vs. scaled scores looks like a cubic function.

NY Common Core Algebra Exam cubic fit

Running a cubic regression on the (raw score, scaled score) pairs yields

f(x) = 1.13 + 3.96x -0.76x^2 + .0005x^3

R^2 = 0.99

That is a remarkably strong correlation.  Clearly, those responsible for creating this conversion began with the assumption that the conversion should be modeled by a cubic function.  What is the justification for such an assumption?  It’s hard to believe this is anything but an arbitrary choice, made to produce the kinds of outcomes the testers know they want to see before the test is even administered.

These conversion charts are just one of many subtle ways these tests and their results can be manipulated.  Jonathan Halabi has detailed the recent history of such manipulations in a series of posts at his blog.  These are the kinds of things we should keep in mind when tests are described as objective measures of student learning.

Related Posts


Follow

Get every new post delivered to your Inbox

Join other followers: