Regents Recap — June 2014: Common Core Scoring
Here is another installment in my series reviewing the NY State Regents exams in mathematics.
June, 2014 saw the administration of the first official Common Core Regents exam in New York state, Algebra I (Common Core). Roughly speaking, this exam replaces the Integrated Algebra Regents exam, which is the first of the three high school level math Regents exams in New York.
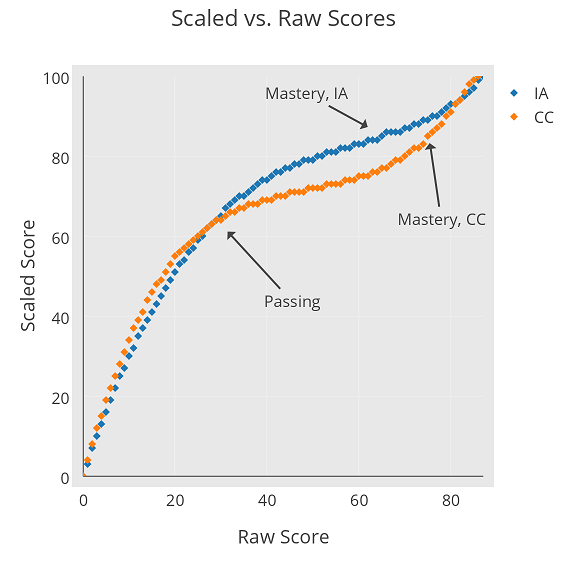
One of the biggest differences in the two exams is how raw scores were converted to scaled scores. In the graph below, Integrated Algebra is represent in blue, Algebra I (Common Core) in orange. Raw scores are on the horizontal axis, and scaled scores are on the vertical axis.
The raw passing score (a scaled score of 65) is roughly the same for both exams: 30/87 for IA, and 31/86 for CC. But notice the divergence in the plots after a raw score of 30. This is because the raw “Mastery Score” (a scaled score of 85) is quite different for the two exams: 65/87 on IA, vs 75/86 on CC.
It’s curious that the exams could be evaluated in such a way that passing requires the same raw score on both, but mastery requires a much higher score on one than the other. If the exams were of equal difficulty, this would mean the same percentage of students would pass the exam, while dramatically fewer students would achieve mastery on the Common Core exam.
This is especially curious, since the tests don’t really seem that different to me apart from some substantial changes in content emphasis. It’s hard not to see this as merely a deliberate decision to lower the mastery rate.
Furthermore, the consensus is that raw scores on the Common Core exam are substantially lower than on the Integrated Algebra exam. Based on the exams and on conversations I’ve had, I wouldn’t be surprised if scores on the Common Core exam were lower than scores on the Integrated Algebra exam by 10 raw points on average. This would lead to an even larger drop in mastery rates, as well as a drop in passing rates.
There’s an interesting opportunity here, though. I’m certain that a large number of students across New York state took both the Algebra I (Common Core) exam and the Integrated Algebra exam. This offers a unique opportunity to directly compare the tests and the conversion charts the state decided upon.
I think the Department of Education should release that data so we can see for ourselves just how different student performance was on these two exams, and judge for ourselves the consequences of these very different conversion charts.
Related Posts
- Regents Recaps
- Regents Recap — June 2016: Scale Maintenance
- Regents Recap — June 2015: Cubics, Conversions, and Common Core

0 Comments