Using Mathematics to Create — Geogebra

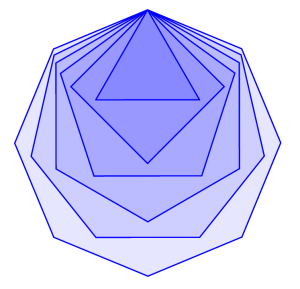
Geogebra Student Work -- TriangleOne of my guiding principles as a math teacher, as I articulate in this TEDx talk, is to provide students with tools and opportunities to create with mathematics.  Few things are as aligned with that principle as well as Geogebra, the free, open-source, dynamic geometry environment.

I’ve integrated a lot of Geogebra work in my Geometry class this year.  I use Geogebra assignments to assess basic geometric skills, to connect old ideas to new, and to explore geometry dynamically.

But much like geometry itself, once you master a few elementary rules in Geogebra, you can create amazing and beautiful works of mathematics.

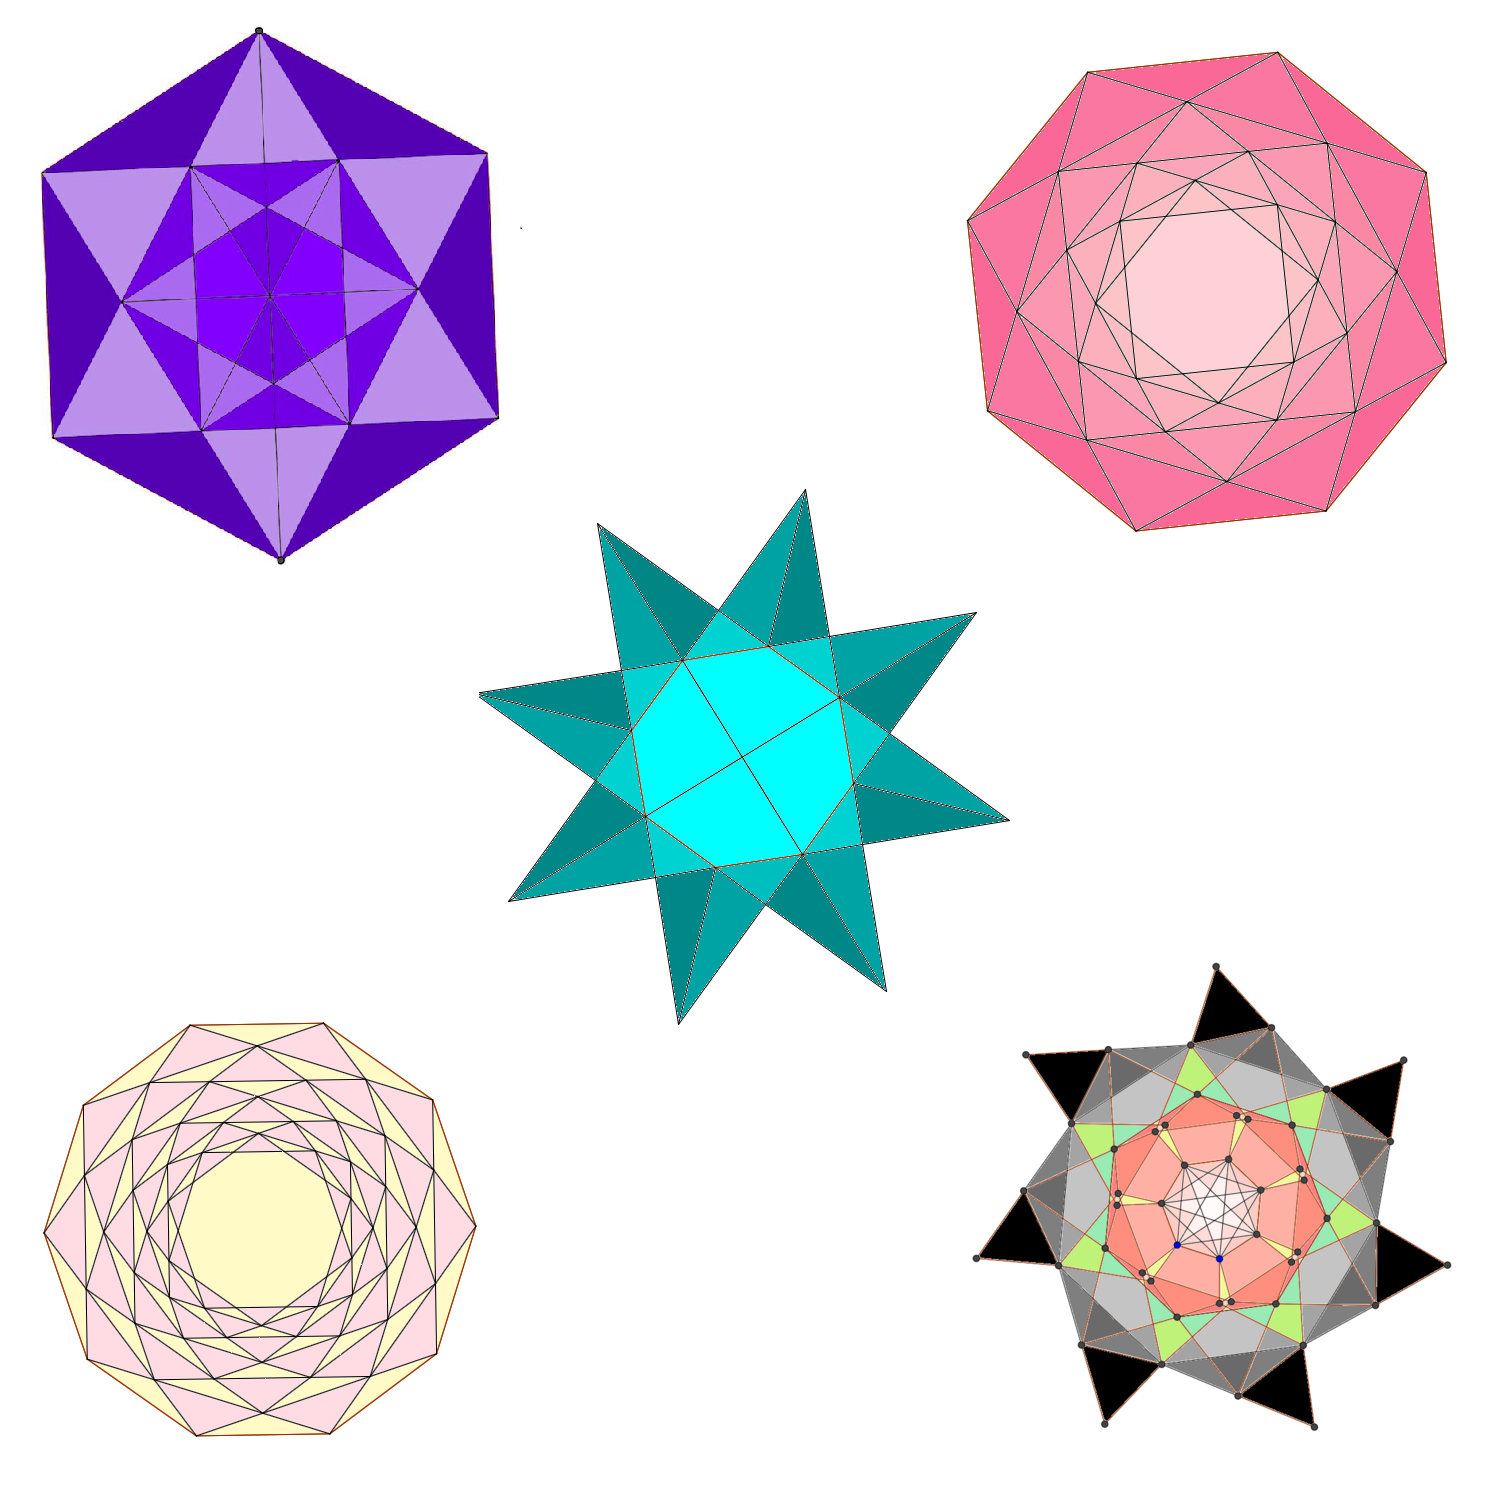
Below is an example of some wonderful student work from this year.  After an introduction to polygons, students were given two simple ideas for creating new objects from polygons:  constructing diagonals and extending sides.  I gave students some technical tips on how to color and polish their final products, and invited them to be creative.  As usual, they did not disappoint.

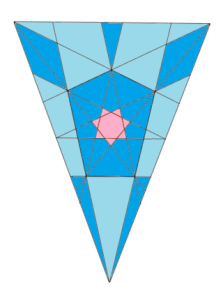
Geogebra Student Work -- Combination

Students, and teachers, need more opportunities to create with mathematics.  We’re fortunate to have technologies like Geogebra that offer us those opportunities.

Related Posts


Why Are We Listening to Andrew Hacker?

I wasn’t planning on attending the math education debate hosted by the Museum of Mathematics.  I have read, and written, enough about Andrew Hacker and his arguments for ending compulsory mathematics education that I didn’t feel it necessary.  But in the end, I decided to go.  After all, there’s something inspiring about hundreds of people attending a public debate about mathematics!

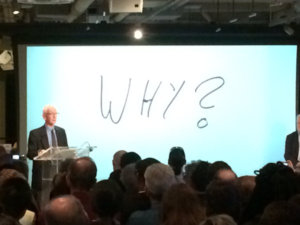
As Andrew Hacker laid out his position, he shared his one visual aid with the audience:

Hacker -- WhyPhoto Credit:  MoMath (link)

He said his argument boiled down to one question:  “Why?”  As in, “Why does every student in the country, regardless of interest, ambition, or ability, have to take a full sequence of advanced mathematics in school?”  It’s not an unreasonable question.

But for me, the real “Why?” question is this:  “Why are we listening to Andrew Hacker?”  And this question inspired my essay, “When it Comes to Math Teaching, Let’s Listen to Math Teachers“, which I wrote for Math for America’s Teacher Voices blog.  Here’s an excerpt:

Andrew Hacker isn’t an expert on mathematics. And he isn’t an expert on math teaching, either. He has every right to voice his complaints, some of which are worthy of consideration, but why has he been given such an enormous platform – high profile Op-Eds, interviews, lectures, a book deal – to address the public about how to “fix” math education?

The fact that Andrew Hacker has such an outsized and undeserved role in steering this conversation is itself one of our problems: we aren’t listening to the right people. If we are really interested in identifying and addressing the problems facing math education today, we should be listening to math teachers.

You can read the entire essay here.

I also live-tweeted the event, along with a few other attendees, using the hashtag #MoMathEdTalk.  You can find the tweets here; several interesting conversations ensued.

And for more of my writing on Andrew Hacker, you can start here.

Related Posts


Computer Science Education in NYC

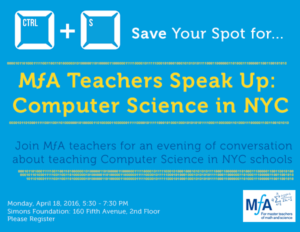
CS in NYCI’ll be participating in a panel discussion on Computer Science education in New York City on Monday, April 18th.  The event will be hosted by Math for America at the Simons Foundation, and is open to the public.

There are many new initiatives promoting the teaching of computer science in K-12 classrooms here in NYC and across the country.  Like many ambitious educational programs, these initiatives often create more questions than answers.

For example, who will teach the newly proposed computer science courses?  Where will the technological infrastructure come from?  And perhaps, more fundamentally, what do we mean when we say computer science?

The purpose of the event is to provide a variety of perspectives on what computer science teaching currently looks like in New York City.  After the moderated panel discussion, there will be a number of informal conversations about issues in computer science education facilitated by MfA teachers.

For my part, I’ll be talking about the mathematical computing course I’ve been developing over the past few years, and how my personal and professional experiences working with technology shape the ways I think about computer science, and how to teach it.

You can learn more about the event, including how to register, here.

UPDATE:  A recap of the event has been posted at the Math for America blog here.

Regents Recap — January 2016: No, It Wasn’t

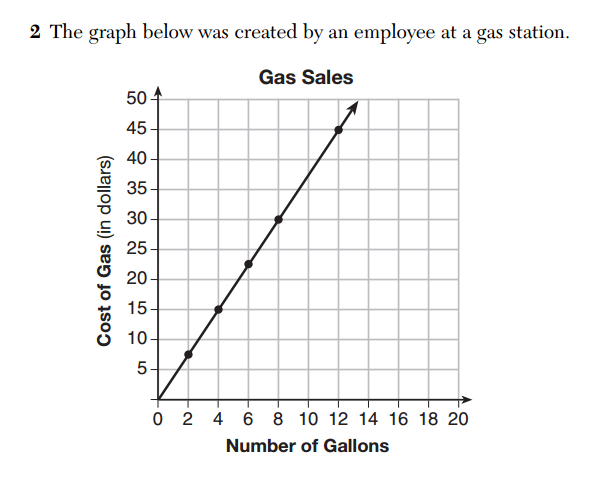
The graph below was created by an employee at a gas station.

No, it wasn’t.gas station graphThis problem from the January, 2016 Common Core Algebra Regents exam is just the latest in a long list of examples of absurdly contrived contexts on high-stakes exams.  There seems to be a school of thought that believes we should go to great lengths to humanize test questions; I honestly can’t imagine why.

Not only does this fabricated context add nothing of value of this problem, it sends the message to students that applications of math are pointless and nonsensical.  And as I argue in my talk g = 4, and Other Lies the Test Told Me, I fear that these messages add up over time.

Yet we know at least one good thing that came from this absurd test question:  statistician Thomas Lumley was creatively inspired by this graph to imagine an amusing back-story!  You can read it at his blog.

And you can find more of my critiques of New York State mathematics exams here.

Related Posts


Celebrating Pi Day

polygons of fixed sideThough I would not consider myself a Pi Day enthusiast, Pi Day has become a sort of Mathematical Awareness day, and so I’ve tried to find meaningful ways to observe it with my students.

One aspect of Pi that I try to get students to appreciate is its invariance.  It’s not just that Pi is the ratio of circumference to diameter in a circle; it’s that Pi is the ratio of circumference to diameter in every circle.  It’s an invariant of circles.  And one way I try to get students to appreciate and respect that invariance is by computing “Pi” for other figures.

For example, consider the square.  The circumference of a square is simply its perimeter.  You could choose to consider the red segment below, which is equal in length to a side of the square, as the square’s diameter.
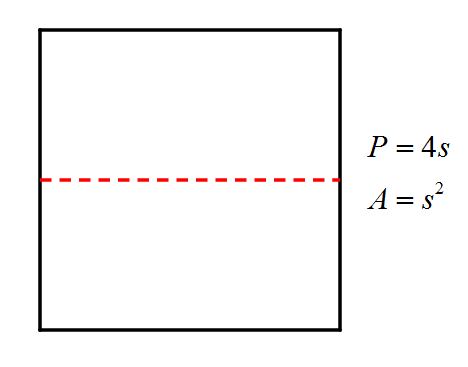
pi day square

Thus, we can calculate “Pi” for a square to be

Pi = \frac{Circumference}{Diameter} = \frac{Perimeter}{Side} = \frac{4s}{s}=4

Thoughtful students may have other suggestions for the “diameter”, which can be a fun exploration in and of itself.  But one way to sidestep this controversy is to simply define “Pi” in a more robust way.

Notice that, in a circle, we have

\frac{Circumference^2}{Area} = \frac{(2 \pi r)^2}{\pi r^2} = \frac{4 \pi^2 r^2}{\pi r^2} = 4\pi

So we can define “Pi” for any plane figure to be one-fourth the ratio of the square of its perimeter to its area.

This simplifies matters, because area and perimeter are well-defined for most figures, whereas diameter is not.  And it’s nice that this new “Pi” is still 4 for a square, since we have

\frac{1}{4} \frac{Perimeter^2}{Area} = \frac{1}{4} \frac{(4s)^2}{s^2} = \frac{1}{4} \frac{16s^2}{s^2} = 4

Once students have generalized the notion of “Pi”, there are several interesting directions to go.  First, you can explore the value of “Pi” for other regular polygons.  What is “Pi” for a regular hexagon?  For a regular octagon?

Of course, something wonderful happens as you look at regular polygons with more and more sides.  With some elementary geometry and trigonometry to derive the formula for the area of a regular n-gon, you can numerically explore convergence to Pi.  And with some knowledge of limits, you can actually prove it converges to Pi!

You could also fix n and explore values of “Pi” for irregular n-gons.  For example, set n = 4 and compare and contrast “Pi” for different rectangles, rhombuses, and parallelograms.  It’s interesting to investigate which kinds of figures have “Pi” values closest to the actual value of Pi.  You might even use this idea to develop a metric for equilateralness.

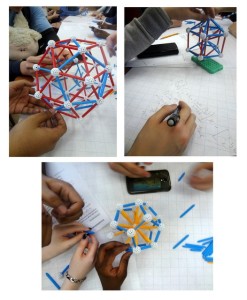
In one of my classes. we took our discussion of “Pi” up a dimension.  With help from a Pi Day grant from Math for America, we used Zometool to explore the value of Pi for solids in 3 dimensions.

We built models of cubes, dodecahedra, icosahedra, triacontahedra, and other solids.  We debated which solids had “Pi” values closest to the actual value of Pi.  Then, starting from the assumption that

Pi \sim \frac{SA^3}{V^2}

we calculated “Pi” for our various solids.  Students had a great time with this hands-on activity!
Pi Day

And most importantly, students came away with a better understanding of, and appreciation for, this remarkable constant.

So let’s find meaningful mathematical ways to celebrate Pi Day!  Make it a Pi Day resolution.

Related Posts
 

Follow

Get every new post delivered to your Inbox

Join other followers: