12 Ways to Use the NYT to Develop Math Literacy

Here’s my latest contribution to the New York Times Learning Network:  a collection of ideas for math activities that are built around content from the New York Times.

http://learning.blogs.nytimes.com/2011/02/28/12-ways-to-use-the-times-to-develop-math-literacy/

The activities run the gamut of the paper, and include examples in Finance, Real Estate, Dining and Sports, among others.  Here’s an example:

1. Find Your Dream Home

How much would you pay for 1,000 square feet of living space inNew York City? What about Los Angeles? Use the Real Estatesection of The Times to compare and contrast the cost of housing in different parts of the country, or even different parts of the world.

Or find a home for sale in your area, find an up-to-date interest rate (for that, you might try ERate), and use the mortgage calculatorlocated next to the real estate listing to compute your monthly payment over the term of the loan. How much would you have to earn per year to afford your dream home? How long would it take to save up enough for your down payment?

Mathematical Biographies

old mathematiciansThis is a comprehensive library of on-line biographies of mathematicians, brought to you by the School of Math and Statistics at the University of St. Andrews, Scotland.

http://www-history.mcs.st-and.ac.uk/BiogIndex.html

This is a truly remarkable resource.  It looks as though they have thousands of mathematicians in the database, and you can search the biographies by author, region, area, or mathematical topic.

Each entry contains a bio, a list of publications, awards, pictures, and other related materials.  You can also check out their famous curves index.

Bravo, SMSUSAS!  This is the kind of thing that the internet was really made for.

Related Posts


Cool Knot Animations

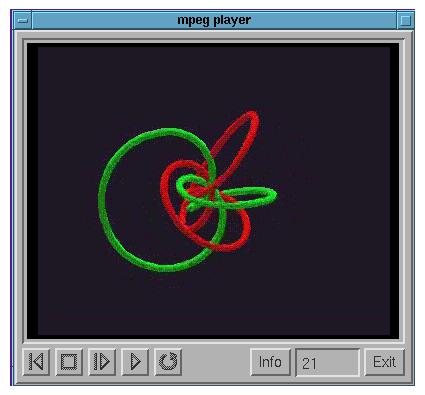
knot animationThis is a nice collection of some lovely mathematical images and animations:

http://www.math.ru.nl/knopen/

There are some knot animations, some 3-D fractals, and some cool surfaces.  It seems as though these images and animations were generated in Maple.

There are also some nice images generated in some kind of ray-tracing program that may or may not be called vort.

Vort could also be the name of the person who created all these images.  I’m not sure; my Dutch isn’t very good.

2011 Top Careers and Math

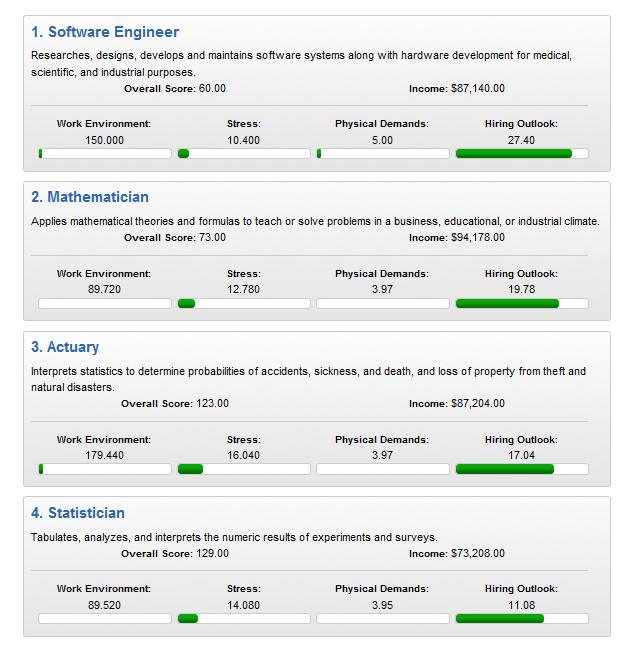
top jobs chartThis report from CareerCast ranks 200 jobs from best to worst:

http://www.careercast.com/jobs-rated/2011-ranking-200-jobs-best-worst

Jobs were analyzed based on five factors:  Environment, Income, Outlook, Stress, and Physical Demands.

As is so often the case in these job-ranking surveys, math-based careers fared very well:  coming in at #2 is Mathematician (whatever that means), #3 is Actuary (always near the top of these lists), and at #4 is Statistician (great if you like stats, I suppose).

I guess Roustabout is not as much fun as it sounds, as it placed 200th in the rankings.  And I’ve met a lot of happy, successful Taxi Drivers (#192) in my life.

It’s not surprising to see Teacher in the #100 spot, with its high stress-to-income ratio.  But Surgeon right behind at #101?  According to the results, it’s about 3 times as stressful but about 7 times the pay.

Might be worthwhile to take a closer look at the methodology, which can be found here.

The Most Beautiful Equations

beautiful equationsThis is a nice comment-thread and poll on Quora responding to the question “What is the most beautiful equation?”

http://www.quora.com/Mathematics/What-is-the-most-beautiful-equation

No surprise to see Euler’s Identity on top with a whopping 350 votes.

There are fun entries all throughout thread, and I definitely learned a few things through perusing.   And I guess I can forgive the participants for including some inequalities on the list.

Follow

Get every new post delivered to your Inbox

Join other followers: