Maybe Monkeys Can’t Do Algebra

giuseppe monkeyThere is a controversy brewing around Harvard scientist Marc Hauser, his research students, and his published results.  Some of Hauser’s work–which apparently focuses on the cognitive ability of non-human primates–has come under scrutiny, and one of his articles has been retracted.

According to the abstract, the retracted article (“Rule-Learning By Cotton Top Tamarins“) discussed how tests usually performed on human infants were used to “assess whether cotton-top tamarin monkeys can extract abstract algebraic rules”.  Obviously the results of the study are now in question, but it’s a fascinating idea nonetheless.

Computer Modeling of Gulf Oil Dispersion

oil spill modelThis is an interesting computer simulation of the potential spread of the gulf oil disaster throughout the Caribbean and Atlantic:

http://www.youtube.com/watch?v=nAiG-TPYIFM

This reminds me of weather-prediction models:  input some initial conditions, set up the propagation rules, and then iterate, iterate, iterate.  Of course, modeling the mathematics of the initial conditions and the propagation rules is a huge challenge.

Making the Trains Run On Time

An interesting article in the New York Times (with a cool interactive graphic) digs down into the data of “on-time performance” for the three major NYC-area railways–LIRR, Metro North, and NJT.

http://www.nytimes.com/2010/07/27/nyregion/27ontime.html
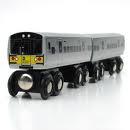
trainThe official figure is that 96% of trains arrive on time.  This may be hard for the average commuter to believe, but it is technically true.  What accounts for this discrepancy between perception and performance?

As the data shows, trains were far more likely to run behind schedule during peak times (rush hours) than during non-peak times.  This makes intuitive sense–more people on the trains, more trains running simultaneously, and so more potential problems and delays.  But this also means that a delay during rush hour will affect more people, and thus have a greater impact on the perception of the train’s timeliness than, say, a late-night lateness.

Furthermore, there are only a couple of “rush” hours, so the total number of rush-hour trains is less than the total number of non-rush-hour trains.  The latter are more likely to run on time, and so their aggregate impact on overall performance dominates the calculation.

To simplify, if 5 out of 10 rush hour trains are late (50%), and 5 out of 50 non-rush hour trains are late (10%), then  the overall lateness ratio is 10 out of 60, or about 17%.  But a lot more people are riding the rush hour trains, and to them, it seems like the trains are late half the time.  This is a example of the Inspection Paradox.

There are also some interesting psychological principles at work here:  for example, people will generally think more about the one time they are late than, say, the 10 times the train ran on-time.  It will be even more significant if that lateness ends up costing you something–like a good impression on a client or a boss.

Mathematics of Construction

One of the items on my to-do list was build something.  To that end, I spent the afternoon turning a bunch of leftover lumber into a small table.

TableI’ve always admired those who can build elegant and functional things, but I came away from my project with an even greater appreciation for carpenters, woodworkers, builders, and the like.  The measuring:  how far are those legs spaced apart?  The calculating:  when all these pieces get put together, how tall is this thing supposed to be?  The engineering:  why are things rolling off my table?  It’s a set of serious cerebral challenges on top of the obvious physical demands.

One theme that stood out as I slowly assembled my table was that of error propagation.  A tiny error at an early stage (a millimeter or two of slant on a “flat” cut on a leg) can produce a sizable error in the end (things quickly rolling off your table).

It put me in mind of the classic differential problems in elementary calculus.  For example, suppose you are measuring the diameter of sphere with a margin of error of +/- .1 mm:  how much error might this generate in calculating the volume of the sphere?  The surface area?

An even more complex problem is understanding how different errors interact with each other, which is something I experience frequently while putting this table together!

How Much is Newsweek Worth?

newsweekI really enjoyed reading Newsweek when I was younger–I loved the political cartoons, the quick-hit section in the front, the in-depth pieces on issues I knew nothing about.  So I’ve been watching with interest as the Washington Post Company completes the sale of the news magazine for a reported $1 dollar and assumption of debt.  Newsweek–like many print publications–has been losing money for a while, so this is not much of a surprise.

There are a lot of interesting stories going on here:  the ongoing saga of print and online media; Sidney Harmon, of Harmon-Kardon audio fame, is the buyer and has no clear media experience; and Harmon’s wife, Jane, is a U.S. Representative.  But it was the following analysis of the finances of Newsweek that really caught my interest:

http://www.cjr.org/the_audit/the_newsweek_numbers.php

Someone published a copy of the [presumably confidential] sales presentation on the web, and the revenue and cost data is fascinating:  apparently Newsweek spent around $100 million (about 60% of its annual revenue of $160 million) to produce, distribute, and manage the physical magazine.  How can a magazine, any magazine, seriously compete head-to-head with an online publication, one that can provide a similar service while avoiding $100 million in such costs?

This drastically changing industry is a good place to look at changing business and finance models.

Follow

Get every new post delivered to your Inbox

Join other followers: