
While playing around building trains, it occurred to me that one link of curved track was a nice, everyday representation of 
While playing around building trains, it occurred to me that one link of curved track was a nice, everyday representation of
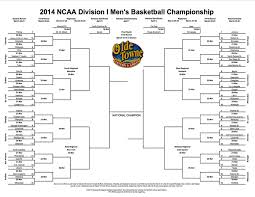 My latest piece for the New York Times Learning Network leverages March Madness to explore some basic ideas in counting and probability.
Begin by having students explore how to count the number of possible brackets. Start by analyzing a four-team bracket, say, with Team A playing Team B and Team C playing Team D in the first round. Have the students directly list the eight possible tournament outcomes: For example, A beats B, D beats C, and then D beats A is one such outcome. The use of tree diagrams may be helpful in representing the possible brackets.
Then ask students to predict and explore how many brackets are possible with an eight-team tournament. There are 2 raised to the 7th power, or 128, such brackets. One way to see this is first by noting that eight teams in a single-elimination tournament will end up playing seven total games: Seven of the eight teams must be eliminated, which requires that they lose a game.
I’m glad I could make a small contribution to the Math Madness surrounding March Madness! You can find the entire lesson here.
![]() I’m excited to be speaking at the upcoming conference of the New York State Mathematics Association of Two-Year Colleges (NYSMATYC) .
I’m excited to be speaking at the upcoming conference of the New York State Mathematics Association of Two-Year Colleges (NYSMATYC) .
The NYSMATYC is the country’s oldest professional organization devoted to mathematics and two-year colleges. The NYSMATYC focuses on supporting mathematics teachers and students at two-year colleges across New York state through publications, awards, scholarships, and regional conferences.
The theme of this year’s conference is “The Career Journey” and runs April 4th-6th. I’ll be giving the banquet keynote address on Saturday night, where I’ll be talking about my own career journey and offering my thoughts on the rapidly evolving landscape of of mathematics education.
You can find out more about the organization and the conference at the NYSMATYC website.
I don’t usually celebrate Pi Day, but a variety of inspirations intersected at a fun project idea this time around.
Thanks to Math for America, I participated in a terrific workshop on Zometool earlier this year, led by George Hart. We built, explored, conjectured, proved, and collaborated around a lot of rich mathematical ideas. And this semester, Steven Strogatz is teaching a History of Math course at Cornell, and he has been generously sharing thoughts and resources online. As a result, I have been reading up on the derivations of the volume and surface area formulas for Platonic and Archimedean solids.
So when I recently re-watched James Tanton’s brilliant video “What is Pi for a Square?“, the idea hit me: for Pi Day, students could explore the value of “Pi” for various Zometool-constructible solids!

What makes James Tanton’s exploration so wonderful is that it highlights the invariance of Pi in circles (as circumference by diameter) while inviting students to play around with the notions of “diameter” “radius”, and “Pi” in regular polygons. We’ll be taking the question “What is Pi?” up a dimension, and thanks to Zometool, we have a tangible context for our conversations and calculations.
We’ll be exploring properties of polyhedra, calculating areas, volumes and ratios, arguing about definitions, and comparing the sphereness of various things. I’m looking forward to a great day of mathematics! And perhaps discovering what the value of “Pi” is for a rhombic triacontahedron.
 Through Math for America, I am part of an ongoing collaboration with the New York Times Learning Network. My latest contribution, a Test Yourself quiz-question, can be found here
Test Yourself — Math, March 12, 2014
This problem is about a bike-based window washer in New York City. How much can he earn per year washing storefronts?