Regents Recap — June 2012: Some Improvement

Here is another installment from my review of the June 2012 New York State Math Regents exams.

I tend to be rather critical in my evaluation of these exams, pointing out poorly constructed, poorly phrased, and mathematically erroneous questions.  However, there have been some minor improvements of late.

First, it seems as though, in general, the wording of questions has improved slightly.  To me, questions on the June 2012 exams were more direct, specific, and clear than in the recent past.

There were also some specific mathematical improvements.  For example, although graphs were often unscaled, they seemed generally more precise, avoiding issues like this asymptote error.

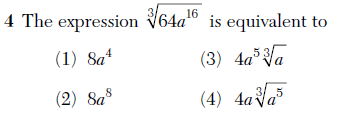
There were considerably fewer instance of non-equivalent expressions being considered equivalent.  The problem below avoids the domain-issues that plagued recent exams.

Perhaps it’s just luck, but we’ll give the exam writers the benefit of the doubt for now.

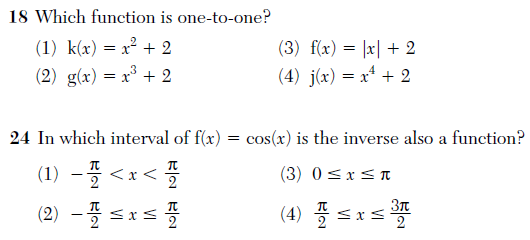
And the Algebra 2 / Trig exam definitely demonstrated a more sophisticated understanding of 1-1 and inverse functions, which is good to see in the wake of this absolute embarrassment from last year.

Perhaps someone has been reading my recaps?

Let’s hope we see continued improvement in the clarity and precision of these exams.  If these exams are going to be play such an important role in today’s educational environment, it seems of utmost importance that they be accurate and well-constructed.
Regents Recap — June 2012: Spot the Function

Here is another installment from my review of the June 2012 New York State Math Regents exams.

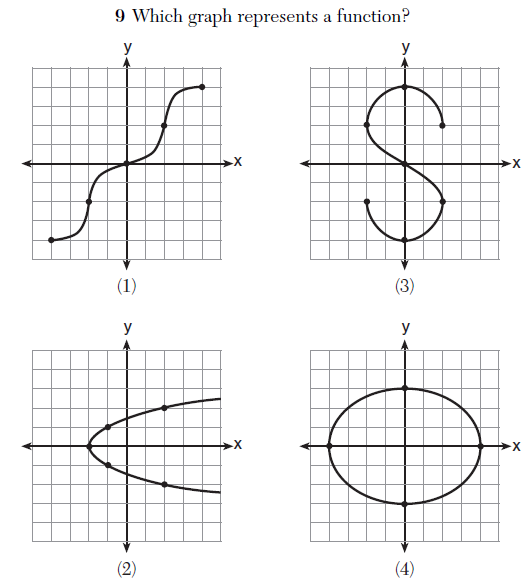
Below is a problem from the Integrated Algebra exam.  Which of these graphs represents a function?

Have you identified the function?  Well, you’re right, because all of these graphs could represent functions!

What the question presumably intends to ask is “Which of these graphs represents y as a function of x?”  Under this interpretation, the correct answer is (1).  But in (2), we see a graph that represents x as a function of y.  So it, too, represents a function.

Indeed, even graphs (3) and (4) could represent parametric functions.  For example, (4) could be written.

r(t) = < 4 \thinspace cos(t) , 3 \thinspace sin(t) > , 0 \le t < 2\pi

This plane curve is a function of t.

I doubt this makes much practical difference in the outcomes on this exam, but precision is important in mathematics; it should be modeled for students on official assessments.  And those writing these important exams should be familiar enough with the content to write precise and accurate questions.

Regents Recap — June 2012: Throwing Darts

Here is another installment from my review of the June 2012 New York State Math Regents exams.

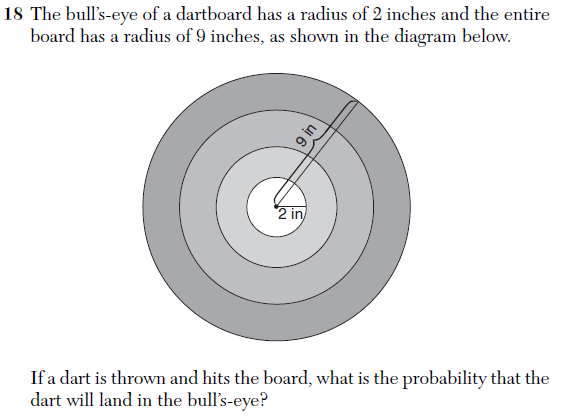
Below is a problem from the Integrated Algebra exam that highlights the artificiality of so-called “real world” problems.

In order to solve this problem in a high school algebra class, a crucial assumption must be made, namely, that every point on the target is equally likely to be hit.  This means that the dart is just as likely to hit a spot near the bulls-eye as any spot near the edge.

Math teachers end up spending a lot of time training students to make these assumptions, probably without ever really talking explicitly about them.  It’s not necessarily bad that we make such assumptions:  refining and simplifying problems so they can be more easily analyzed is a crucial part of mathematical modeling and problem solving.

What’s unfortunate is that, in practice, students are kept outside this decision-making process:  how and why we make such assumptions isn’t emphasized, which is a shame, because exploring such assumptions is a fundamental mathematical process.

Is it a reasonable assumption that every point is equally likely to be hit?  Well, if the thrower is skilled, the dart is probably more likely to land near the bulls-eye.  Would gravity make the lower-half more likely than the upper half?  Discussing these, and other relevant factors as part of the modelling process can be engaging, fun, and highly mathematical.

But when standardized tests with “real world” problems are the focus of education,  students usually end up getting trained to not ask these questions.

Regents Recap — June 2012: Unscaled Graphs

Here is another installment from my review of the June 2012 New York State Math Regents exams.

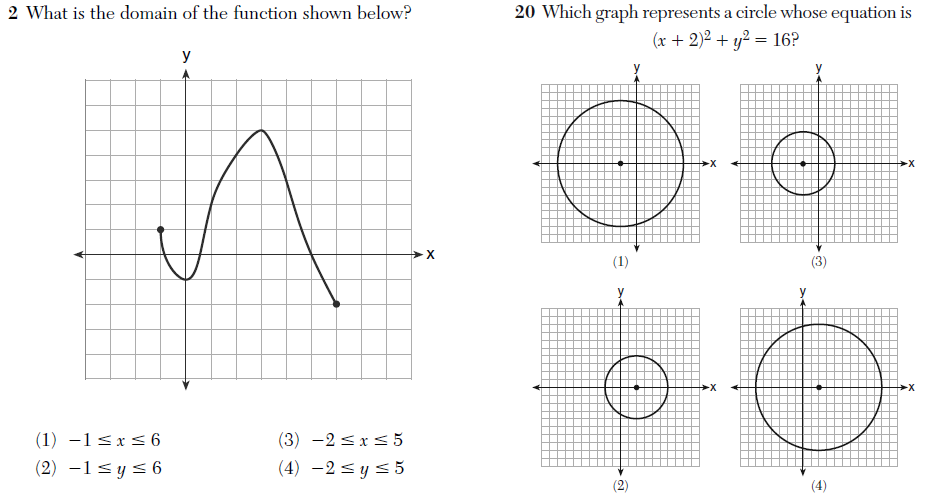
On the left is a problem from the Algebra 2 / Trigonometry exam; on the right, a problem from the Geometry exam.

Notice that no scale is indicated on any of the graphs here.  That is, there is no indication of what “one unit” is equivalent to on any graph.

I admit that I’m pretty sloppy when it comes to labeling graphs, however I know some teachers make accurate labeling and scaling a point of emphasis when it comes to creating graphs.  Properly understanding the scale of a graph can be of crucial importance, especially when trying to with questions pertaining to specific numeric values, as in these above.

Tests should stand as models of mathematical content and practice for students; they should not reinforce bad mathematical habits, like ignoring scale.

Regents Recap — June 2012: Poorly Constructed Questions

Here is another installment from my review of the June 2012 New York State Math Regents exams.

Below are a few examples of what I consider “bad” questions.  “Bad” here might mean poorly worded, poorly conceived, or irrelevant.  In addition, there is an example of a question with a problematic rubric.

First, a type of problem that occurs regularly, one that is a pet peeve of mine.  From the Algebra 2 / Trig exam:

The concept of “middle term” is artificial and depends entirely on how one chooses to evaluate the given expression.  This question does not test an authentic mathematical skill; it tests how well a student executes one particular method of evaluating this particular expression.

Next, an example of a poorly-phrased question, one that confuses mathematical terminology.  From the Integrated Algebra exam:

To “solve” a system of equations, one must find the ordered pairs that satisfy the given equations.  Apparently this question wants only the y-values of those solutions, but the phrasing confuses what it means to “solve a system” and to “solve an equation”.

Students can probably figure out what the question-writer wants to hear in this case, but the lack of precision will only exacerbate confusion about the word “solve”.

Here’s a problem on the Algebra 2 / Trig exam that is simply irrelevant.

This question tests one thing, and one thing only:  knowledge of an arcane and largely irrelevant notation, namely, degree-minute-second representation of angles.  Would anyone outside the nautical or astronomical worlds consider this even remotely valuable?

Lastly, this question from the Integrated Algebra exam is formulated in a reasonable way, but the official scoring guide poses some unnecessary problems.

This question asks the student to graph an equation and then, using the graph, determine and state the roots of the equation.  The correct answer is “2 and -4”, and with appropriate work, is worth three points.

However, if the student gives the answer “(2,0) and (-4,0)”, the student can only earn two out of the three points.  So if the student gives the coordinates of the points where the graph crosses the x-axis, rather than names the “roots” of the equation, there is a one-third deduction.

While I believe that the distinction between roots and points is important, losing one-third credit seems seems unnecessarily punitive here.  If we want to test student’s knowledge of vocabulary, there are better ways to do it than by sneaking it in at the end of an involved algebra problem.

Moreover, since the question requires that the student use the graph, the student is already being forced to interpret the problem in a geometric context.  Penalizing them for thinking of the roots geometrically, then, doesn’t quite seem fair.

Follow

Get every new post delivered to your Inbox

Join other followers: