The test is a staple of modern education, and not just at the classroom level. Today, tests can determine which public schools a child can attend, whether or not a student graduates, which districts get state aid, and of course, which colleges might want you.
There is a movement afoot which seeks to legally tie teacher job performance to student test scores. There’s a simple argument at the core of this movement (“If students are doing poorly on tests, then the teacher must be doing a poor job”), and a simple counterargument (“There many factors beyond a teacher’s influence that affect student test performance”), but it’s a complex issue, and it has generated much controversy.
As the debate rages on in educational, political, and media circles, one particular aspect of this issue rarely gets discussed: test quality. If the tests being used to evaluate students, schools, and now teachers, are ill-conceived, sloppy, and erroneous, how legitimate a measure of teaching and learning could they possibly be?
In short, few people connected to this issue seem interested in the rather important question “Are these tests any good?”
I will address this question in a series of posts that examine the New York State Math Regents Exams. I’ll begin this series by looking at three questions from the multiple choice section of the 2011 Algebra II and Trigonometry exam. The official test and scoring guide can be found here.
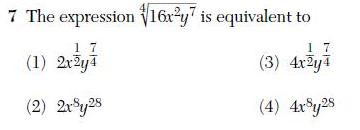
First, an algebra question: which answer is equivalent to the given expression?

The “correct” answer, according to the scoring guide, is (1). However the real answer is that none of these are equivalent to the original expression. For two expressions to be equivalent, they must agree for every possible value of their variables. Let x = -1 and y = 1; the original expression evaluates to 2; the “correct” answer evaluates to undefined(or, if you prefer, to 2i). The two expressions, therefore, are not equivalent.
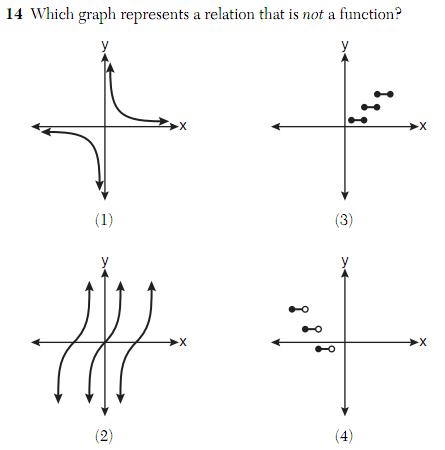
Now consider this question about graphs: which graph is not a function?
 A simple way to determine if a graph is the graph of a function is to use the vertical line test: if a vertical line can be drawn through the graph so that it intersects the graph more than once, then the graph is not the graph of a function. The “correct” answer according to the scoring guide, is (3), which is indeed not a function. But take a closer look at (2):
 As the red vertical lines suggest, this graph also appears to fail the vertical line test. Therefore it is not a function. This question has two correct answers, only one of which was awarded credit.
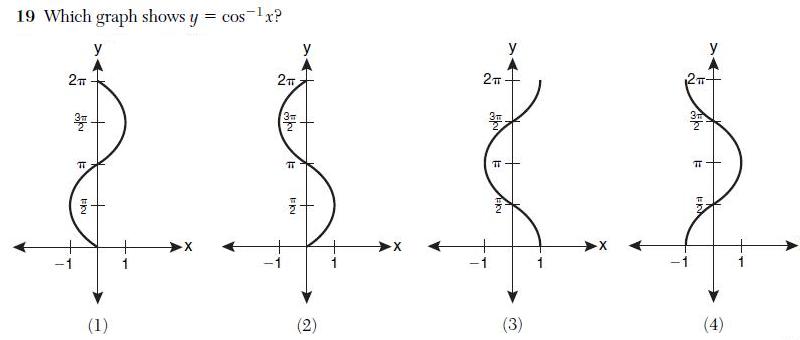
Lastly, consider this question, again about graphs.
 As it turns out, none of these graphs is the graph of
  . The graph in (3), the “correct” answer, is only part of the correct graph. It is not the entire graph. The actual graph of
  extends infinitely up and down. (If you feel that the notation
  implies a restriction, note that none of these restrictions are correct, either).
While it may seem that some of the issues raised here are merely technicalities, keep in mind that technicalities play an important role in mathematics. Furthermore, students who truly understand the relevant issues here might actually be at a disadvantage on these questions, wasting time sorting through these poorly-conceived problems and worrying about which answer to give.
A lot could be riding on this test: student graduations, teacher jobs, schools closings. With the stakes so high for so many, it seems like we should be paying closer attention to the question: Are these tests any good?
 I love spending time with my niece and nephew. They are inquisitive, thoughtful, energetic, fun, and always up for anything. As math is often on my mind, mathematical ideas often come up when we’re together. I love exploring math with them: we talk about numbers, ponder questions, play with shapes, estimate things. They usually enjoy it, and if they don’t, they don’t mind telling me so. Just like the rest of my students.


