A nice consequence of maintaining a blog is that it makes year-end reflecting very convenient. And 2013 was certainly a full, challenging, and fun year!
In February, my talk “g = 4, and Other Lies the Test Told Me” was featured in GothamSchools. The talk highlights how standardized testing often works in opposition to the work that teachers do, and was part of MfA’s inaugural Master Teachers on Teaching conference. Video of my talk can be seen here.
In April, I hosted TEDxNYED 2013. After speaking at the previous TEDxNYED, I was proud to be a part of bringing the event to Brooklyn Tech. Many students attended and were able to enjoy a number of great, thought-provoking talks. And two of my students gave a TED talk on the peer-to-peer math enrichment program they created! You can see the video of their talk here.
In May, I was featured at Scientific American as one of the winners of the inaugural Rosenthal Prize. And later in the year, my award-winning lesson on Sphere Dressing was published and made freely available by the National Museum of Mathematics.
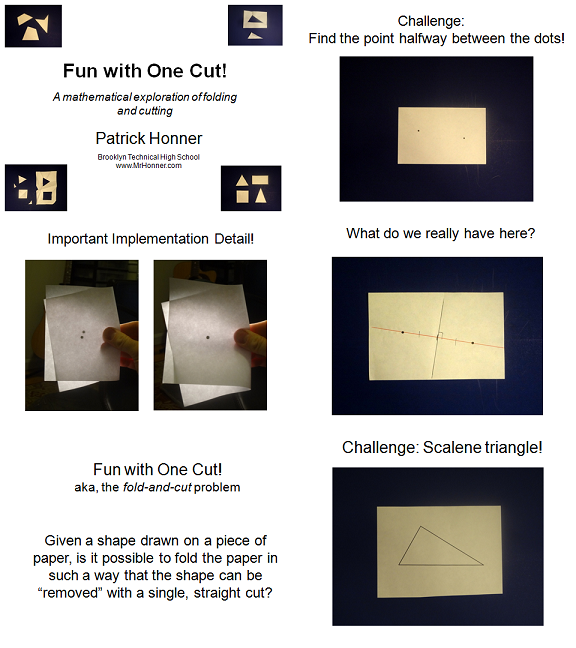
In July I traveled to Enschede, the Netherlands, for the Bridges Math and Art conference, where I presented a short paper on teaching math through image manipulation and displayed some pieces in the Bridges art gallery.
In August, I ran a workshop at the inaugural MOVES conference at the Museum of Mathematics. That month, I also wrote a piece for GothamSchools on how the new, common core-aligned New York State tests looked remarkably like the old exams. The piece generated a lot of great conversation, and led to a thought-provoking blog-exchange with noted educator and curriculum specialist Grant Wiggins about testing, rigor, and mathematics.
In September I was named a New York State finalist for the Presidential Award for Excellence in Mathematics and Science Teaching (PAEMST).
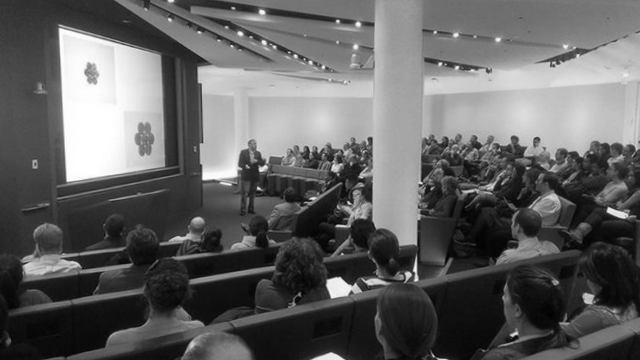
In October I ran a workshop on teaching and social media through Math for America, and met Fields Medalist Cedric Villani.
In November I ran a workshop at the annual TIME 2000 conference, and hosted artist and computer programmer Nathan Selikoff at Brooklyn Tech, who inspired our students with a talk about the history and practice of algorithmic art.
Coming full circle, in December I gave a talk at the second annual MT^2 conference, on my mathematical relationship with change.
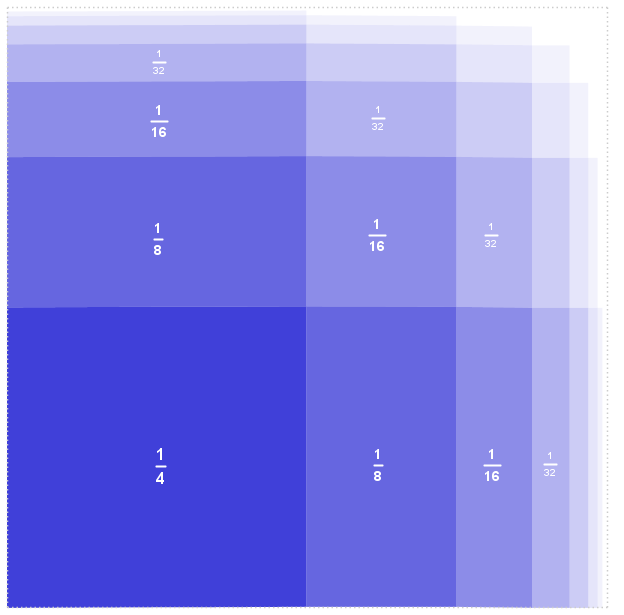
And throughout the year, I continued to contribute to the New York Times Learning Network, writing many Test Yourself Math questions, and pieces on teaching the mathematics of infinity, how math is beautiful, Bitcoin and currency, and science and religion.
All in all, it was a busy, fun, and productive year, maybe even busier than 2012! As is tradition, I’ll end this year hoping for a little more downtime in the next.
Related Posts
 I was excited to receive this month’s issue of Math Horizons, published by the Mathematical Association of America, which features my interview with Steven Strogatz!