Investigating the Math Behind Biased Maps

My latest piece for the New York Times Learning Network gets students investigating the mathematics of gerrymandering.  Through applying geometry, proportionality, and the efficiency gap, students explore the notion of a “workable standard” for identifying and evaluating biased electoral maps.

Here is an excerpt:

Math lies at the heart of gerrymandering, in which the shapes of voting districts and distributions of voters are manipulated to preserve and expand political power.

The strategy of gerrymandering is not new… However, new, sophisticated mathematical and computer mapping tools have made gerrymandering an even more powerful way to tilt the playing field. In many states, where the majority party has the authority to rewrite the electoral map, legislators essentially have the power to choose their voters — to create districts in any shape or size that will weaken their opponents and increase their dominance.

In this lesson, we help students uncover the mathematics behind these biased electoral maps. And, we help them apply their mathematical knowledge to identify and address the problem.

In fact, the questions students will work through are similar to those the Supreme Court is now considering on whether gerrymandering can ever be declared unconstitutional.

The article was co-authored with Michael Gonchar of the NYT Learning Network, and is freely available here.

Related Posts


Regents Recap — August 2017: Yes, You Can Work on Both Sides of an Identity

In a controversial post last year, I argued that it’s perfectly acceptable to work on both sides of an equation in proving an algebraic identity. While it’s common to tell students “You can’t cross the equal sign” in this situation, doing so is mathematically legitimate as long as the new equation is true under exactly the same circumstances as the original.

For example, when proving an algebraic identity, multiplying both sides of an equation by 2 is permissible, because = y and 2x 2y are true under exactly the same conditions on x and y. Squaring both sides of an equation however, is not, since

x^2 = y^2

can be true under conditions that make y false, say, when x and y-2.

The post in question, “Algebra is Hard”, was a response to a June 2016 Regents scoring guide that deducted a point from a student who, in proving an algebraic identity, multiplied both sides of the equation by a non-zero quantity. The student was penalized for “not manipulating expressions independently in an algebraic proof“, a vague and meaningless criticism.

“Algebra is Hard” received quite a bit of attention, and while many agreed with me, I was genuinely surprised at how many readers disagreed. Which was terrific! Of course my argument makes perfect sense to me, but it was great to have so many constructive conversations with teachers and mathematicians who saw things differently.

But my argument recently received support from the most unlikely of sources: another Regents exam.

Take a look at this exemplar full-credit student response to an algebraic identity on the August 2017 Algebra 2 exam.

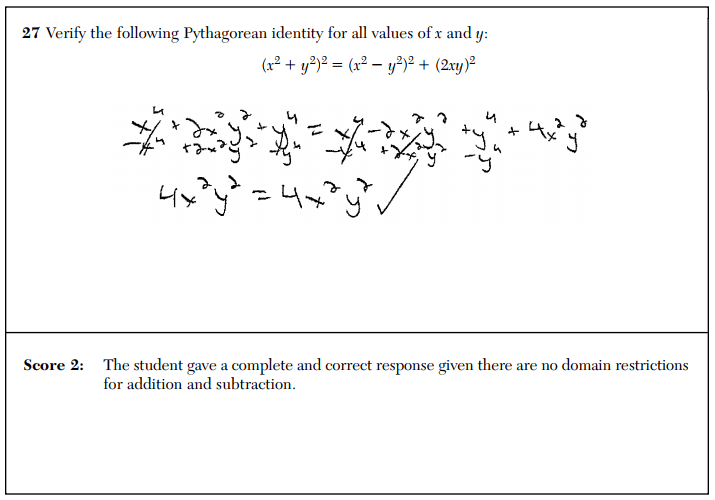
Notice that the student works on both sides of the equation and subtracts the same quantity from both sides. Even though the student did not manipulate expressions independently in an algebraic proof, full credit was awarded.

The note here about domain restrictions is an amusing touch, given that it was the explicit domain restriction in the problem from 2016 that ensured the student wasn’t doing something impermissible (namely, multiplying both sides of an equation by 0).

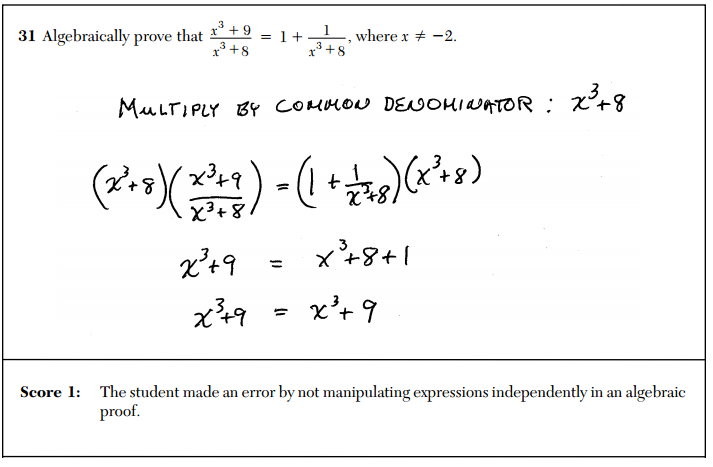
So in 2016 this work gets half credit, and in 2017 this work gets full credit.

While it’s nice to see mathematically valid work finally receiving full credit on this type of problem, it’s no consolation to the many students who lost points for doing the same thing the year before. What’s especially frustrating is that, as usual, those responsible for creating these exams will admit no error nor accept any responsibility for it.

Be sure to read “Algebra is Hard” (and some of the 40+ comments!) for more of the backstory on this problem.

Related Posts

The Math Behind Gerrymandering and Wasted Votes — Quanta Magazine

The U.S. Supreme Court is currently considering a case about partisan gerrymandering in Wisconsin and Texas. One of the keys to the case is the “efficiency gap”, an attempt quantify the partisan bias in a given electoral map. For my latest article in Quanta Magazine, I explain and explore the efficiency gap using simple examples, and talk about some of the implications of this particular measurement.

Imagine fighting a war on 10 battlefields. You and your opponent each have 200 soldiers, and your aim is to win as many battles as possible. How would you deploy your troops? If you spread them out evenly, sending 20 to each battlefield, your opponent could concentrate their own troops and easily win a majority of the fights. You could try to overwhelm several locations yourself, but there’s no guarantee you’ll win, and you’ll leave the remaining battlefields poorly defended. Devising a winning strategy isn’t easy, but as long as neither side knows the other’s plan in advance, it’s a fair fight.

Now imagine your opponent has the power to deploy your troops as well as their own. Even if you get more troops, you can’t win.

The full article is freely available here.

Regents Recap — June, 2017: More Trouble With Statistics

High school math courses contain more statistics than ever, which means more statistics questions on end-of-year exams.  Sometimes these questions make me wonder what test makers think we are supposed to be teaching.  Here are two examples from the June, 2017 exams.

First, number 15 from the June, 2017 Common Core Algebra exam.

This question puzzled me.  The only unambiguous answer choice is (3), which can be quickly eliminated.  The other answer choices all involve descriptors that are not clearly defined:  “evenly spread”, “skewed”, and “outlier”.

The correct answer is (4).  I agree that “79 is an outlier” is the best available answer, but it’s curious that the exam writers pointed out that an outlier would affect the standard deviation of a set of data.  Of course, every piece of data affects the standard deviation of a data set, not just outliers.

From the Common Core Algebra 2 exam, here is an excerpt from number 35, a question about simulation, inference, and confidence intervals.

I can’t say I understand the vision for statistics in New York’s Algebra 2 course, but I know one thing we definitely don’t want to do is propagate dangerous misunderstandings like “A 95% confidence interval means we are 95% confident of our results”.  We must expect better from our exams.

UPDATE: Amy Hogan (@alittlestats) has written a nice follow up post here.

Related Posts

Regents Recap — June, 2017: Three Students Solve a Math Problem

I will never understand why so many exam questions are written like this (question 5 from the June, 2017 Algebra exam):

What is the purpose of the artificial context?  Why must the question be framed as though three people are comparing their answers?  Why not just write a math question?This question not only addresses the same mathematical content, it makes the mathematics the explicit focus.  This would seem to be a desirable quality in a mathematical assessment item.

Instead of wasting time concocting absurd scenarios for these problems, let’s focus on making sure the questions that end up on these exams are mathematically correct.

Related Posts


Follow

Get every new post delivered to your Inbox

Join other followers: