Teaching with the ASA’s Election Prediction Contest

My latest piece for the NYT Learning Network gets students using statistics and data analysis to create entries for the American Statistical Association‘s Election Prediction contest.

The ASA’s contest invites students to predict the winner of each state in the upcoming Presidential election, as well as the vote-share for each major party candidate.  My piece offers students some basic strategies to consider when making their predictions.

A straightforward strategy for predicting the winner of each state would be to use the latest aggregate polling data from a reputable source. The New York Times offers a state-by-state probabilities chart that provides a projected outcome for each state as determined by each of several media outlets, including The Times itself as well as FiveThirtyEight and Daily Kos, among others.

Students could choose one of the outlets to use as the basis for their predictions, but to satisfy the written requirement of the contest they should be prepared to provide some justification for their choice. For example, they could research each outlet’s methodology and explain why they found one more compelling than another (perhaps more polls are used from each state, or the predictions have been more stable over time).

In addition to introducing students to several basic prediction strategies, there are plenty of links to online resources where students can explore visualizations of voting trends and research historical voting data.  The lesson is freely available here.

The ASA’s contest ends October 24th, so get predicting!
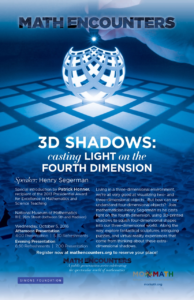
Henry Segerman at MoMath

segerman-math-encounterMathematician, artist, and 3D-printing virtuoso Henry Segerman will be speaking at the Museum of Mathematics on October 5th, 2016.

Henry is currently a professor at Oklahoma State University, where he researches geometry, topology, and mathematical visualization.  His mathematical 3D printing is truly amazing:  to start, you can check out his triple gears, stereographic projections, and Hilbert curves.  And he has recently published a book, Visualizing Mathematics with 3D Printing, that includes companion 3D prints that readers can download for free and print themselves!  He is also involved in fascinating work in spherical video (see this spherical droste video for an example) and virtual reality, and has been featured in several Numberphile videos.

Henry will be giving a talk as part of MoMath’s Math Encounters series.  His talk is titled “3D Shadows: Casting Light on the Fourth Dimension”, and is sure to make for a fascinating evening.  I am proud and excited to be introducing Henry, whom I’ve known for many years, and whose work inspires me both as a mathematician and as a teacher.

You can find out more about the event and register here.

UPDATE:  The museum has made Henry’s full talk is available here.

Scratch@MIT Conference, 2016

Scratch MIT logoI’m excited to be participating in this summer’s Scratch@MIT conference.

The conference, held at MIT Media Labs, brings together educators, researchers, developers, and other members of the Scratch community to share how they use Scratch, the free, block-based, web-based programming environment, in and out of classrooms.  The theme of this year’s conference is Many Paths, Many Styles, which aims to highlight the value of diversity in creative learning experiences.

I’ll be running a workshop on Mathematical Simulation in Scratch, which will introduce participants to some of the ways I’ve been using Scratch in my math classes.  I’m looking forward to sharing, and learning!  And I’m grateful to Math for America, whose partial support has made it possible for me to attend.

The 2016 Scratch@MIT conference runs from August 4th through 6th.  You can find more information here.

Related Posts


Using Mathematics to Create — Geogebra

Geogebra Student Work -- TriangleOne of my guiding principles as a math teacher, as I articulate in this TEDx talk, is to provide students with tools and opportunities to create with mathematics.  Few things are as aligned with that principle as well as Geogebra, the free, open-source, dynamic geometry environment.

I’ve integrated a lot of Geogebra work in my Geometry class this year.  I use Geogebra assignments to assess basic geometric skills, to connect old ideas to new, and to explore geometry dynamically.

But much like geometry itself, once you master a few elementary rules in Geogebra, you can create amazing and beautiful works of mathematics.

Below is an example of some wonderful student work from this year.  After an introduction to polygons, students were given two simple ideas for creating new objects from polygons:  constructing diagonals and extending sides.  I gave students some technical tips on how to color and polish their final products, and invited them to be creative.  As usual, they did not disappoint.

Geogebra Student Work -- Combination

Students, and teachers, need more opportunities to create with mathematics.  We’re fortunate to have technologies like Geogebra that offer us those opportunities.

Related Posts


KC Math Tech Expo

I’m excited to announce that I have been invited to speak at the 2016 Kansas City Mathematics Technology Expo!

For 25 years, the KC Math Tech Expo has brought together mathematics teachers from the college and secondary level to discuss technology and teaching.  This year’s conference will be held October 7th and 8th at the University of Missouri, Kansas City.

I’ll be giving the Invited Address on Saturday, and mathematician and 3D-printing expert Laura Taalman will be giving the Keynote on Friday evening.  You can find out more about the conference here.

I’m looking forward to connecting with teachers through mathematics and technology in Kansas City this October!

Related Posts


Follow

Get every new post delivered to your Inbox

Join other followers: