The Math of Social Distancing is a Lesson in Geometry — Quanta Magazine

My latest column for Quanta Magazine connects the geometry of social distancing, a topic on everyone’s mind right now, with sphere packing, a problem mathematicians have been working on for hundreds of years.

Determining how to safely reopen buildings and public spaces under social distancing is in part an exercise in geometry: If each person must keep six feet away from everyone else, then figuring out how many people can sit in a classroom or a dining room is a question about packing non-overlapping circles into floor plans.

In two dimensions, the sphere packing problem is really the circle packing problem, and the best way to pack circles in the plane is known. But it was only recently that mathematicians settled the question about how to most efficiently pack spheres in dimensions 8 and 24. And there are still many open questions in other dimensions!

You can read the entire article here.

To Win This Numbers Game, Learn to Avoid Making Math Patterns — Quanta Magazine

My latest column for Quanta Magazine starts with a simple game of numbers and ends with some unsolved problems in mathematics.

For example, let’s change the rules to make the loser the first person to complete three in a row of any step size. This means you lose if you make 2-3-4, as in the original game, but also if you make 1-3-5 (three in a row of step size 2) or 1-4-7 (step size 3). These patterns are “arithmetic progressions”: sequences of numbers with a common step size, called the common difference.
Let’s return to our first game board and use the new rules. It’s still your turn. And you’ve lost.

This simple game, where each player tries to avoid completing an arithmetic progression, leads to some complicated math, involving open questions about Salem-Spencer sets and a new result about polynomial sequences.

The full article is available here and includes several exercises to test your game play!

2020 AP Calculus BC Practice Exams

The 2020 AP Calculus BC exam will be very different in scope and structure than previous years, as a consequence of logistical issues brought on by the COVID-19 pandemic. The College Board has indicated the test items will be similar to those on past exams, but there aren’t many existing practice materials designed with the 2020 format in mind.

I’ve created two sample practice exams for my BC Calculus students and will share them here for teachers and students looking for additional resources. All are welcome to use them, but keep in mind that these are merely guesses about what the exam might be like in terms of scope and difficulty. I will say that I intentionally tried to make these more challenging than the College Board’s sample exam, which is just a re-combination of existing 2019 items. (I referred to this as Practice Exam #1, which is why you see #2 and #3 below.)

Please use as you see fit. And let me know if they are helpful!

STEM for All Video Showcase

Next week I’ll be a facilitator and judge for the 2020 STEM for All Video Showcase. This event highlights hundreds of innovative projects designed to improve Science, Mathematics, Engineering, and Computer Science education in both formal and informal settings.

Thousands of educators, researchers, policy makers, parents, and students actively participate in the event, and the videos are watched by hundreds of thousands of people worldwide. The showcase runs from May 5th to May 12th, and everyone is invited to watch the videos, participate in the conversations, and vote for their favorites!

Find out more at the STEM for All Video Showcase website.

Related Posts

7 Ways to Explore the Math of the Coronavirus Using the New York Times

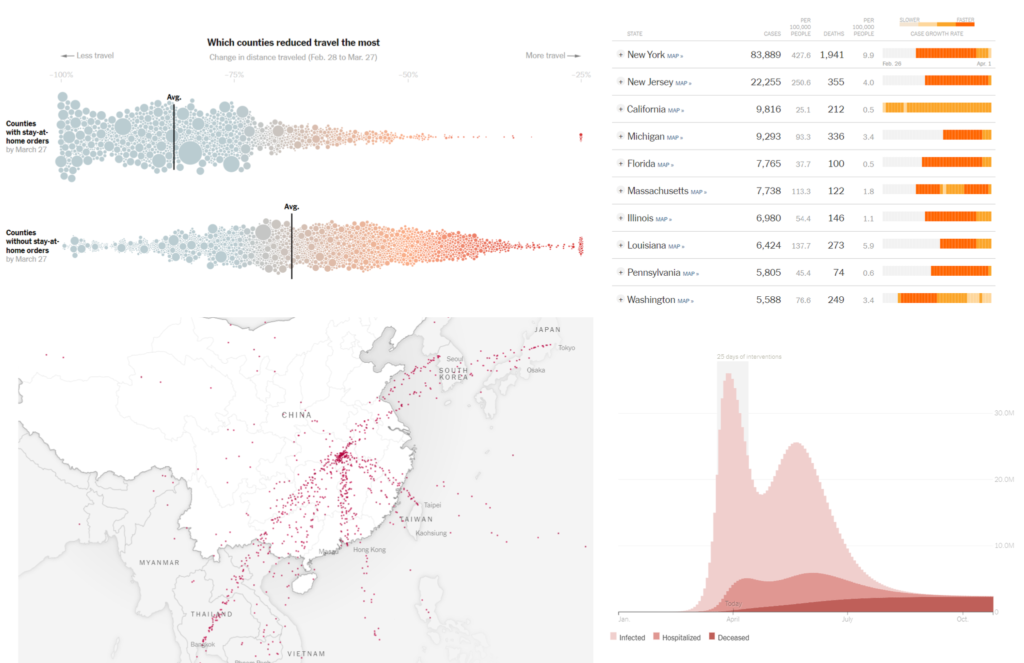
My latest piece for the New York Times Learning Network is “7 Ways to Explore the Math of the Coronavirus Using the New York Times”, a collection of ideas for using NYT articles, infographics, and interactives to explore the mathematics underlying the current coronavirus epidemic.

The opportunities range from statistical literacy to network theory. Here’s an example of some data analysis you can engage in using a wonderful NYT interactive:

By using sliders to change, for example, the level of intervention (e.g., moderate or aggressive) or the length of intervention (e.g., 14 days or 60 days), students can see how outcomes change. And, by playing with the model, they will be able to answer questions like: “What is the impact of shortening our social distancing period?” or “What happens when we delay the start of our interventions?”

The full article is freely available on the New York Times Learning Network.

Follow

Get every new post delivered to your Inbox

Join other followers: