Math Quiz: NYT Learning Network

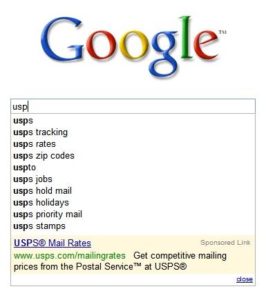
google searchThrough Math for America, I am part of an on-going collaboration with the New York Times Learning Network.  My latest contribution, a Test Yourself quiz-question, can be found here:

http://learning.blogs.nytimes.com/2011/03/16/test-yourself-math-march-16-2011/

This question is based on Google-search statistics, specifically how much traffic is driven to the top two Google search results.

Based on the numbers, it’s easy to see why companies are willing to bend the rules to climb the rankings!

Math Lesson: NCAA Rankings

ncaa trophyMy latest contribution to the NYT Learning Network is a mathematics lesson build around the way NCAA basketball teams are ranked.

http://learning.blogs.nytimes.com/2011/03/14/whos-no-1e-investigating-the-mathematics-of-rankings/

Quantitative rankings are ubiquitous these days, and they are playing an ever-increasing role in teaching.  Colleges have been “ranked” by publications for years, but now public schools are being assigned grades and even teachers can be ranked according to complicated, and often controversial, formulas.

In this lesson, students are tasked with creating their own rankings of the sports teams.

Looking only at winning percentage, therefore, may not be a fair assessment of who is better than whom: if Team X plays in a relatively weak conference, and Team Y plays in a relatively strong conference, it will be easier for Team X to record wins. This is similar to the idea of ranking students based on unweighted G.P.A.’s: such a system may well reward students who take relatively easy classes and put students with more challenging programs at a disadvantage.

So, student pairs should explore approaches to addressing this issue by attempting to quantify a team’s strength of schedule, thereby creating a ranking system that will take into consideration the quality of each team’s opponents.

These rankings only make as much sense as the underlying mathematics.  Hopefully, through investigating the way the NCAA ranks basketball teams, teachers and students can learn to deconstruct these ranking systems and better evaluate their utility .
Math Quiz: NYT Learning Network

Gold barThrough Math for America, I am part of an on-going collaboration with the New York Times Learning Network.  My latest contribution, a Test Yourself quiz-question, can be found here:

http://learning.blogs.nytimes.com/2011/03/02/test-yourself-march-2-2011/

This problem is based on the re-opening of long-closed gold mines due to the rising price of gold.  Apparently, it’s now financially worthwhile to go back in and collect the scraps that were left behind.

12 Ways to Use the NYT to Develop Math Literacy

Here’s my latest contribution to the New York Times Learning Network:  a collection of ideas for math activities that are built around content from the New York Times.

http://learning.blogs.nytimes.com/2011/02/28/12-ways-to-use-the-times-to-develop-math-literacy/

The activities run the gamut of the paper, and include examples in Finance, Real Estate, Dining and Sports, among others.  Here’s an example:

1. Find Your Dream Home

How much would you pay for 1,000 square feet of living space inNew York City? What about Los Angeles? Use the Real Estatesection of The Times to compare and contrast the cost of housing in different parts of the country, or even different parts of the world.

Or find a home for sale in your area, find an up-to-date interest rate (for that, you might try ERate), and use the mortgage calculatorlocated next to the real estate listing to compute your monthly payment over the term of the loan. How much would you have to earn per year to afford your dream home? How long would it take to save up enough for your down payment?

Math Quiz: NYT Learning Network

us china moneyThrough Math for America, I am part of an on-going collaboration with the New York Times Learning Network.  My latest contribution, a Test Yourself quiz-question, can be found here:

http://learning.blogs.nytimes.com/2011/02/14/test-yourself-math-feb-14-2011/

This problem is based on comparing the total national incomes of the United States and China.  My solution offers a simple way to turn per capita income and population into meaningful percentages.

Follow

Get every new post delivered to your Inbox

Join other followers: