Clever Carton Accounting

It is a well-known marketing principle that you’ll make more money charging the same for less than charging more for the same amount.

So I wasn’t too surprised when I noticed that something had changed about my usual 64-ounce carton of orange juice.

oj-closeup

Instead of raising the price of the 64-ounce carton of orange juice from $3.99, the good people at Tropicana just reduced the amount of orange juice I’d get by 5 ounces.  At the old price, orange juice cost around 6.25 cents per ounce.  At the new price, it costs about 6.78 cents per ounce.  That 5 ounce drop in quantity is effectively an 8.5 percent price increase!

I’m sure Tropicana knows that if they raised the price of a 64-ounce carton of orange juice to $4.33, some people would think twice about buying it.  People are comfortable paying $3.99 for their product, and they might be uncomfortable paying $4.33 for it.

Instead, by reducing the amount, the company can effectively raise the price without disturbing the consumer’s comfort level.  And since people pay more attention to price than they do to quantity, most consumers probably won’t even realize they are paying more.

And just in case they might notice, why not keep the carton the exact same size?

Related Posts


Weather Forecast Accuracy Statistics

weatherThis website aims to evaluate the accuracy of various weather-prediction services while providing its own forecast:

http://forecastadvisor.com/

Using composite indices and statistical methods, data from sites like Accuweather and Weather.com  is analyzed and rated.

This is a good resource for an interesting group or individual project in statistics:  how accurate are the various services?  What is a “good” prediction?  How valuable is this information?  How can we use statistics to evaluate these questions?

Several years ago I read this post from the Freakonomics blog:  it details an informal study conducted by a man and his daughter who looked at seven months of TV weather forecasts in Kansas City and evaluated their accuracy.  The entire article is interesting, but the bottom line is best summed up in a quote from someone from one of the TV stations:  ““We have no idea what’s going to happen [in the weather] beyond three days out.”

NFL Draft Math: Analysis

After posting some thoughts on the mathematics of NFL Draft Pick Valuation, let’s take a look at what actually happened during the 2011 NFL Draft and see just how much credence NFL teams put into to the Trade Value Chart.

A quick re-cap:  the Trade Value Chart estimates what should expect in return for trading their pick.  The valuation of picks resembles exponential decay, and the draft format may also play a role in determining a pick’s value.

There were thirteen trades of draft picks during the first two days of the draft (Rounds 1 through 3), so I collected all of the data and tallied up the nominal values of the picks based on the chart.  Here are two examples of a trades:  the Picks row contains the picks that the team traded away; the Total Value row contains the sum of the values of the picks based on the Trade Value Chart.

trade-analysis-chart
In both cases, the larger total value is a little bit more than 10% of the smaller value.  Here is a summary of all the trades in Rounds 1 through 3.

trade-analysis-chart-summary

A couple of notes:  first, when future picks were involved in a trade, I assumed that the future pick would be the same pick number as this year’s pick, and I valued it as such.  That is, I assumed that the 2012 first round pick Atlanta sent to Cleveland would be number 27 overall, and therefore its value would be 680 points.  For percent difference, I measured the difference relative to the smaller total value.

The relative values seem close enough to suggest that the teams are using the Trade Value Chart as a guide, a conclusion also reached by @EmergentMath in his interesting analysis of past Draft day deals.

The notable exceptions in this year’s draft both involve New England, a team that is highly regarded for its skillful draft management.  They have a exceptional record for team-building, so maybe some serious mathematical analysis of draft strategy has paid dividends!

Related Posts


More NFL Draft Math: Pick 33

nfl draft 2-- staffordI recently discussed some mathematics involved in the NFL Draft:  teams use a Trade Value Chart to rate the value of the different picks in the draft, and how the picks are “priced” leads to some interesting consequences, which I covered in this post.

The value of pick number 33 has fostered some interesting conversation, brought about by changes in the way the draft is run.  Originally conducted over two days with Round 2 immediately following Round 1, the NFL in 2010 reorganized the draft to take place over three days.  Now, Round 1  takes place on a Thursday night and then Round 2 begins a full day later.  (The change was presumably made to increase TV ratings, and it seems to have worked).

Now the first pick in Round 2 is the 33rd overall pick.  Noted football writer Peter King speculated last year that this new format would increase the value of pick 33, offering the following argument: with a full day to re-evaluate the remaining players after Round 1 ends, demand for the 33rd pick would grow as teams realized that coveted players were still available.  Increased demand would therefore increase the value of the pick.

The argument sounds reasonable, but ultimately I don’t think the value of this pick changes significantly.  I’ll offer both mathematical and practical counter-arguments.

First, the mathematical counter:  let’s start by noting that in any sensible rating of draft picks, the value of the picks should strictly decrease as the pick number increases.  For example, pick 21 should never be more valuable than pick 20.  Every player available at pick 21 is also available at pick 20, and at pick 20, there will be one additional player available.  In short, pick 20 gives you all the value of pick 21, plus a little more.

If the new format did increase the value of pick 33, it couldn’t raise the value above that of pick 32.  If you accept the values in the Trade Value Chart, this means the value of pick 33 (580 points) could not rise to more than the value of pick 32 (590 points), which means the most the pick could increase in value is around 1%.

Now, the practical counter:  NFL teams invest a lot of time, money, and resources into draft preparation.  It doesn’t seem likely that any team would be caught off-guard by which players are available at pick 33.  They should be just as prepared for that scenario as they are at pick 32, or pick 1, for that matter.

If a team does find itself scrambling between Round 1 and Round 2, dramatically re-valuing pick 33, then I’d that the team wasn’t properly prepared overall to begin with.  I would also suggest that team call me in for an interview!

Related Posts


NFL Draft Math

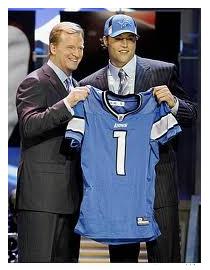
nfl draftThere’s a lot of mathematics going on in the NFL Draft.  Here’s one example.

In the National Football League’s player draft, every franchise is allotted one pick per round to select draft-eligible players for their team.  The initial draft order is determined by the prior year’s standings, with the last year’s worst team (by record) picking first each round.

The opportunity to select a player is a valuable asset, and picks are often traded among teams before, or during, the draft.  Teams might look to trade up to obtain an earlier pick (in order to select a coveted player), or trade down to get extra picks in the later rounds (turning one high pick into two or more low picks).

An interesting mathematical question is “What is Draft Choice N worth?”  It’s easy to say that the first overall pick is worth “a lot”, and the second pick overall is worth “slightly less”, but how can position in the draft really be quantified?

It turns out that football analysts have created a trade value chart that essentially standardizes the value of picks .  For example, a team holding the 7th overall pick, valued at 1,500 points, might expect to receive the 21st pick (800 points) and the 26th pick (700 points) in return, were they to trade their pick.  This conventional valuation helps establish fair prices for trades, as it would in any commodities market.

So what are the picks worth?  I pulled the numbers from the trade value chart and created this graph.
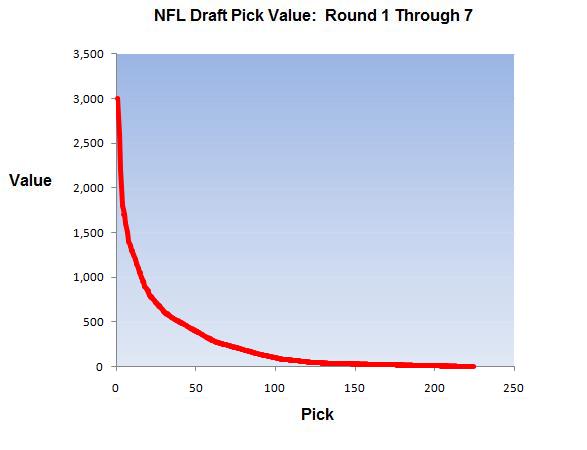
NFL Draft Pick Value Chart

The drop-off in value is steep:  for example, the 1st overall pick is considered twice as valuable as the 7th overall pick; the 7th pick is twice as valuable as the 23rd pick, which is twice as valuable as the 52nd pick.  There is no simple formula, but the graph above definitely suggests exponential decay:
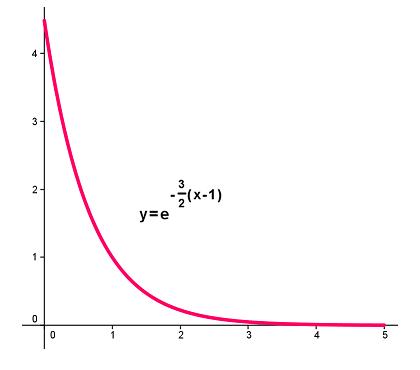
exponential function

It’s not clear why the model for draft pick valuation should resemble exponential decay (which describes radioactive decay and cooling to ambient temperatures, among other things), but the resemblance is clear.

It’s important to understand that this is merely a practical guide to draft position valuation.  The real value of a draft choice depends not just on position, but on many other factors as well:  the overall quality of available players, the needs of your team, the needs of your competitors, and contract issues, to name a few.

If you could figure out a more meaningful, or accurate, way to quantify these picks, you could probably help an NFL franchise get a leg up on the competition!

Related Posts


Follow

Get every new post delivered to your Inbox

Join other followers: