 While playing around with distances from points to graphs, I discovered the following interesting property of parabolas.
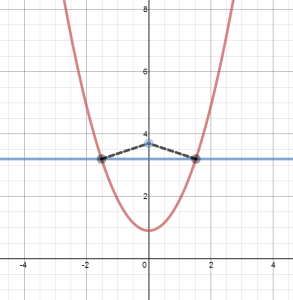
Suppose you have a standard parabola,  , and a point on its axis of symmetry,
  . Then the point on the graph of the parabola closest to the point either has y-coordinate equal to
  , or is the vertex of the parabola.
A calculus-based proof is fairly straightforward.
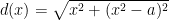
The distance between a point on the parabola, say  and the point is given by
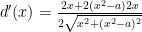
To find the minimum distance, differentiate  to get
This derivative is undefined when the denominator is zero, which only happens when the point is the vertex. The derivative is zero when

By the zero-product property, either  or
or  .
.
The critical value corresponds to the vertex of the parabola. The distance from to the vertex is a minimum if  , or a relative maximum when
  .
.
Now, if 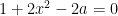 , we have
  . Since on the parabola, the point associated with this critical value has y-coordiante . Some simple analysis shows that the distance to this point is minimal.
As an alternative to optimization, one could approach the problem geometrically. Since the shortest path from a point to a line is the perpendicular line segment connecting them, the shortest path between a point and a curve should be a line segment perpendicular to a tangent to the curve. At a point on the parabola  , the slope of the tangent line is
  , and so the slope of the line perpendicular to the tangent at would be
  . This is equivalent to
  , and since
  is the distance to the axis of symmetry, it follows that this line intersects the axis of symmetry at a point a half-unit up in the y-direction.
This fun and surprising result would make a nice exploration in a Calculus class. It easily extends to general parabolas, and the situation naturally suggests some compelling extension questions.
You can explore the problem, and create variations, in this interactive Desmos demonstration I put together.
 The 2014 Bridges Math and Art conference will be held August 14th through 19th in Seoul, South Korea.