After posting some thoughts on the mathematics of NFL Draft Pick Valuation, let’s take a look at what actually happened during the 2011 NFL Draft and see just how much credence NFL teams put into to the Trade Value Chart.
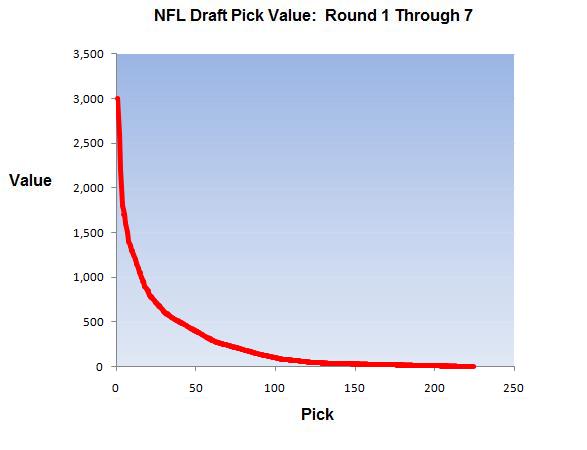
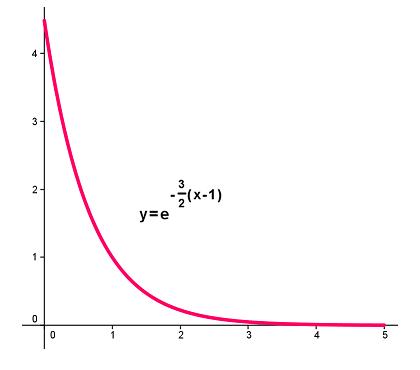
A quick re-cap: the Trade Value Chart estimates what should expect in return for trading their pick. The valuation of picks resembles exponential decay, and the draft format may also play a role in determining a pick’s value.
There were thirteen trades of draft picks during the first two days of the draft (Rounds 1 through 3), so I collected all of the data and tallied up the nominal values of the picks based on the chart. Here are two examples of a trades: the Picks row contains the picks that the team traded away; the Total Value row contains the sum of the values of the picks based on the Trade Value Chart.

In both cases, the larger total value is a little bit more than 10% of the smaller value. Here is a summary of all the trades in Rounds 1 through 3.
A couple of notes: first, when future picks were involved in a trade, I assumed that the future pick would be the same pick number as this year’s pick, and I valued it as such. That is, I assumed that the 2012 first round pick Atlanta sent to Cleveland would be number 27 overall, and therefore its value would be 680 points. For percent difference, I measured the difference relative to the smaller total value.
The relative values seem close enough to suggest that the teams are using the Trade Value Chart as a guide, a conclusion also reached by @EmergentMath in his interesting analysis of past Draft day deals.
The notable exceptions in this year’s draft both involve New England, a team that is highly regarded for its skillful draft management. They have a exceptional record for team-building, so maybe some serious mathematical analysis of draft strategy has paid dividends!
Related Posts


