Weavings and Tilings

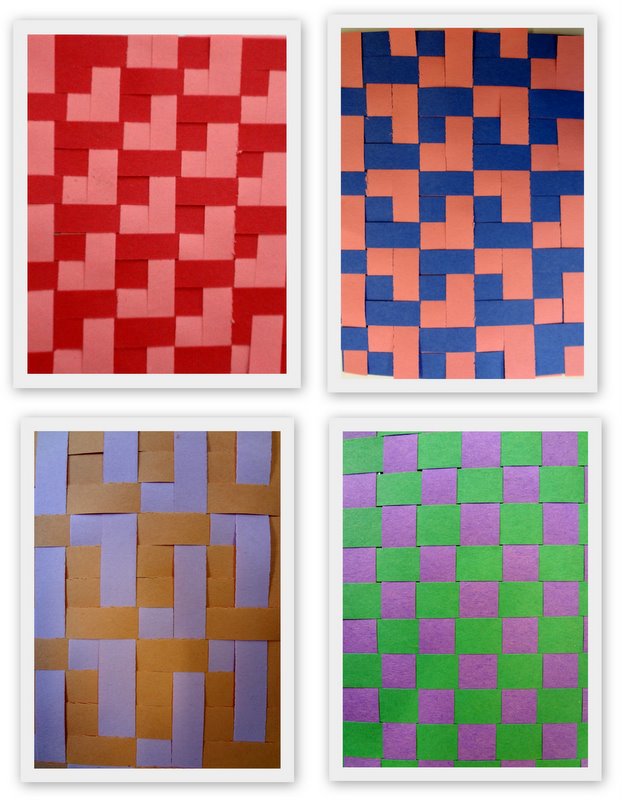
At the Bridges Math and Art Conference in Portugal I learned quite a bit about mathematics and weaving.  One of the many simple and fun ideas I left with was using weaving to explore tilings of the plane.

With some graph paper to plan your tiling, some pre-cut construction paper to assemble them, and some patience to work through the process, you can produce some nice results.  Here are some examples from a recent Math for America workshop I led on Math and Art.  More images can be seen on my Facebook page.

Broadway and Dynamic Ticket Pricing

This story in the New York Times describes how dynamic ticket pricing is helping some Broadway shows stay profitable despite an economic downturn and decreasing attendance.

Variable ticket pricing allows theaters to change prices for seats according to week-to-week or even day-to-day trends that represent fluctuations in supply-and-demand.

According to the article, the theater industry experimented with dynamic pricing during some touring company productions and collected enough data to build a pricing model that could predict weekly box-office demand.  The success of the model allowed them to implement dynamic pricing on Broadway, where they can now adjust prices to optimize sales and profits.

Dynamic pricing has long been used in the airline industry, where ticket prices seem to fluctuate almost randomly as a function of time.  And last year, even the San Francisco Giants experimented a bit with dynamic pricing for their baseball games!

An interesting, and innovative, way to optimize revenue!

Geogebra Resources

This is an amazing collection of hundreds (thousands?) of well-designed Geogebra worksheets:

http://dmentrard.free.fr/GEOGEBRA/Maths/accueilmath.htm

The author, Daniel Mentrard, has put together a huge library of mathematics and physics demonstrations/explorations that are all available for free.

Although the site is in French, it’s not too hard to browse the many Geogebra resources covering Arithmetique, Art et Maths, Algebre, and much more.

And if you like, you can always run the website through Google Translate.

Black Friday Mathematics

I thought I’d do a little analytic research on Black Friday spending, so I punched up Wolfram Alpha to see what it could tell me.

http://www.wolframalpha.com/input/?i=average+consumer+spending+U.S.

Although W|A doesn’t seem to have economic data tied to the specific date, it shows that retail spending in the U.S. is about $386 billion per month, or around $13 billion per day.

A report from Businessweek claims that about $20 billion was spent last year on Black Friday.  This suggests that around $7 billion more is being spent today!

The increase may be even greater.  In its data, Wolfram Alpha includes spending in some categories (motor vehicle and parts dealers–$65.68 billion per month;  food and beverage stores–$51.65 billion per month) that might not be counted as “holiday spending.”   There may be a more targeted metric for measuring the success of Black Friday; researching, or creating, this measure could be a fun little project.

One nice little feature from Wolfram Alpha was the graph of consumer spending.  At the end of each calendar year, there is a sudden spike followed by a steep drop.  It’s not too hard to tell the accompanying story for that data!
Follow

Get every new post delivered to your Inbox

Join other followers: