This is Jeopardy!

jeopardy boardIn the past we tested the prowess of our supercomputers by teaching them to play chess and pitting them against humanity’s greatest players.  Today we test our supercomputers by filling them up with trivia, arming them with a quick trigger finger, and pitting them against America’s greatest Jeopardy! contestants.

On February 14th, 15th, and 16th, IBM’s Watson will compete against Jeopardy! superstars Ken Jennings and Brad Rutter.

This should be a lot of fun.  I can’t wait to see what Watson’s Daily Double strategy is!

More Metrocard Calculations

Inspired by the recent increases in fares for public transit in NYC, I used Geogebra to put together a little graph to compare the various consumer options.

metrocard graphs

The solid red line represents the unlimited monthly card, and this costs $104 regardless of how many times it is used.  The solid blue line represents a pay-per-ride strategy, plotting the total cost against the number of rides purchased.

These lines intersect at the point (49.46 , 104), meaning that the two plans are equivalent if one rides 49.46 times per month.  Graphically, you can see that pay-per-ride is a better value for less than 49.46 rides (it’s lower than the red line), and is a worse value above that number (higher than the red line).

The dotted lines factor in the discount many New Yorkers enjoy by using pre-tax dollars to purchase transit cards.  The use of pre-tax dollars saves you whatever you would have paid in income taxes on that amount:  for New York City residents, the combination of federal, state, and city taxes is around 35% for typical earners.   The discount affects both plans equally, so the point of intersection of the two dashed lines occurs at the same number of rides as the POI of the solid lines.

An astute observer might wonder why the equation of the solid blue line is not y = 2.25 x.  While the fare is indeed $2.25 per ride, by pre-purchasing rides in bulk you receive a 7% discount.  This changes the effective fare per ride, which is taken into consideration in the above graph.  A trip over to the metrocard bonus calculator might shed some light on the subject.

Math Quiz: NYT Learning Network

ponzi schemeThrough Math for America, I am part of an on-going collaboration with the New York Times Learning Network.  My latest contribution, a Test Yourself quiz-question, can be found here:

http://learning.blogs.nytimes.com/2011/01/10/test-yourself-math-jan-10-2010/

This question is based on a recently-filed lawsuit that aims to recover some of the money lost to Bernie Madoff and associates through his expansive and devastating Ponzi scheme.

2010: The Year in Facebook Statistics

facebook logoThis is a cool summary of 2010 in terms of Facebook-related statistics:

http://www.siliconrepublic.com/digital-life/item/19778-facebooks-2010-by-the-numb

With 500 million (!) users, Facebook is rapidly becoming a source of seemingly limitless data about how people live and interact in modern society.  Some of the highlights:

  • Nearly 61 million people changed their relationship status to in a relationship / engaged / married
  • Nearly 43 million people changed their relationship status to single
  • Over 6000 pages were liked every second!  (Speaking of which, how about liking my page?)

The potential applications of analysis of this data, both good and bad, are mind blowing.  As previously noted, people have used Facebook data to identify peak break-up times and to predict someone’s sexual orientation based on their various connections and activity.

Pascal’s, and Rascal’s, Triangles

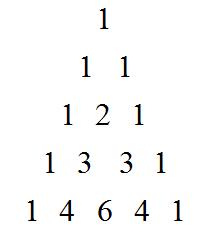
Pascal’s Triangle is one of the most well-known mathematical constructions in human history.  Named after Blaise Pascal, the triangle is rich in patterns and famous number sequences.  The first five rows are shown below.
Pascal triangle five rows

There are many ways to produce Pascal’s Triangle, but the typical way is to define every number as the sum of the two numbers above it:  the one above on the right and the one above on the left.  If there isn’t a number, then just use zero.  For example, 4  = 1 + 3, and 6 = 3 + 3.

The ubiquity of Pascal’s Triangle makes it even more remarkable that a group of three junior high school students have recently collaborated on a paper published in the College Mathematics Journal that uses the famous triangle to find a new number pattern!

Apparently the story begins with one of the students confounding their teacher by insisting that the fifth row of the triangle should be

rascal numbers

Despite the teacher’s attempts to “correct” them, the students produced a valid recursive relationship for the new triangle, which they describe as ( East * West + 1 ) / North.  They then went on to link their definition to a known sequence in the Online Encyclopedia of Integer Sequences and Voila!, mathematical immortality!

As if the story of three eighth-graders publishing a paper in a college mathematics journal isn’t cool enough, the students collaborated entirely via the internet:  one lives in Washington State, one in Alberta, Canada, and one in Indonesia!

A truly inspiring and remarkable story, and an object lesson in encouraging students to pursue their “wrong” answers!
Follow

Get every new post delivered to your Inbox

Join other followers: