Regents Recap — June 2016: Scale Maintenance
This June, the Common Core Algebra Regents exam came with a surprising change in its conversion chart, which is used to translate raw test scores into official “scaled” scores.
Below is a sampling of the conversions from the June 2014 and June 2016 exams. I’ve chosen June 2014, the first administration of the Common Core Algebra Regents exam in New York, as a specific comparison, but those numbers are consistent for all exams given prior to June 2016.
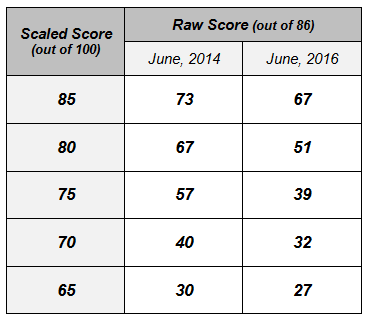
For example, to earn a scaled score of 85 out of 100 on the Common Core Algebra Regents exam (the so-called mastery score), a student had to earn 73 out of 86 points (85%) in 2014, but only 67 out of 86 points (78%) in 2016. The changes are quite dramatic in places: to earn a scaled score of 75, a student had to earn 57 out of 86 points (66%) in 2014, but only 39 out of 86 points (45%) in 2016.
Overall, the new conversion is much more generous. If you happen to teach Algebra in New York state, it should look familiar: it is essentially the conversion used with the old Integrated Algebra Regents exam, which the Common Core Algebra Regents exam replaced in 2014.
Why was such a dramatic change made this year in how this exam is scored? It’s not because the exam has gotten harder. The Common Core Algebra Regents exams have been fairly consistent in difficulty since being introduced in 2014. In particular, the June 2016 exam was roughly equivalent in difficulty to the prior exams.
So then, why the change? Scale maintenance.
Here’s an excerpt from a NY State Education Department memo dated May, 9th, 2016 that reports the recommendations of a workgroup convened by the Board of Regents to study Common Core Regents exam scoring.
In addition, the Workgroup reviewed relevant data from the Regents Examination in Algebra I (Common Core) and recommended that scale maintenance be performed such that the passing standard is realigned with the recommendations of the educator panel from June 2014 when the exam was first administered. [Source]
Scale maintenance.
It seems that when the Common Core Algebra Regents exam was rolled out in 2014, an “educator panel” recommended a conversion chart similar to the one used for the Integrated Algebra Regents exam. Their recommendation was obviously rejected, since the conversion chart that has been used for the past two years is quite harsh, especially for mastery rates. [See here for a visual comparison.]
Adopting this conversion chart now, in 2016, seems like a tacit admission that rejecting the educator panel’s recommendation in 2014 was a mistake. Which seems like an acknowledgement that the exams in 2014 and 2015 were scored improperly.
Regardless of how this is framed, it’s clear that the students who took the exam in 2014 and 2015 have been treated quite unfairly. Had their old scores on comparable exams been scaled using this year’s conversion chart, their official grades would be higher, perhaps substantially so.
This complaint seems to have been anticipated. Here’s another excerpt from the same memo:
The Workgroup recommended the maintenance for the June 2016 administration of the Regents Examination in Algebra I (Common Core) and that the resulting adjustment be applied to this and future administrations only.
In other words, we’ll be seeing this more generous conversion chart for this and all future exams, but if you are a student who took the exam in 2014 and 2015, or a teacher or a school who was evaluated based on those exams, you’re out of luck.
Testing is often presented as an objective means to evaluate student learning and teacher and school performance, but episodes like this clearly demonstrate how subjective it can be. This year, the state simply decided that students would get higher Common Core Algebra Regents scores, and so they did, even though their actual performance probably didn’t change at all. Maybe two years ago, the state simply decided that students should get lower scores, and so those lower mastery rates from 2014 and 2015 might not actually reflect lower student performance.
As a final remark, it’s hard not to think about the word accountability in this situation. For the past decade, “more accountability” has been a common refrain in education, as in, more accountability for teachers, for schools, and for districts. If we’ve been improperly scoring a high-stakes exam for the past two years, and tens of thousands of students and teachers have been affected, will anyone be held accountable for that?
Related Posts
0 Comments