Search Results for: workshop

Scratch@MIT Conference, 2016

Scratch MIT logoI’m excited to be participating in this summer’s Scratch@MIT conference.

The conference, held at MIT Media Labs, brings together educators, researchers, developers, and other members of the Scratch community to share how they use Scratch, the free, block-based, web-based programming environment, in and out of classrooms.  The theme of this year’s conference is Many Paths, Many Styles, which aims to highlight the value of diversity in creative learning experiences.

I’ll be running a workshop on Mathematical Simulation in Scratch, which will introduce participants to some of the ways I’ve been using Scratch in my math classes.  I’m looking forward to sharing, and learning!  And I’m grateful to Math for America, whose partial support has made it possible for me to attend.

The 2016 Scratch@MIT conference runs from August 4th through 6th.  You can find more information here.

Related Posts


An Introduction to Desmos

An Introduction to Desmos

I’ve presented on Desmos many times to teachers, administrators, and students.  So I was excited to bring that experience to the Math for America community through my workshop, An Introduction to Desmos, at the MfA offices in New York City.

Nearly 50 MfA teachers attended, and it was a very active and engaged bunch.  Most attendees were familiar with Desmos, and many were using it in their classrooms.  But I got the sense that everyone’s eyes were opened a bit wider to the power and possibility of this mathematical technology.

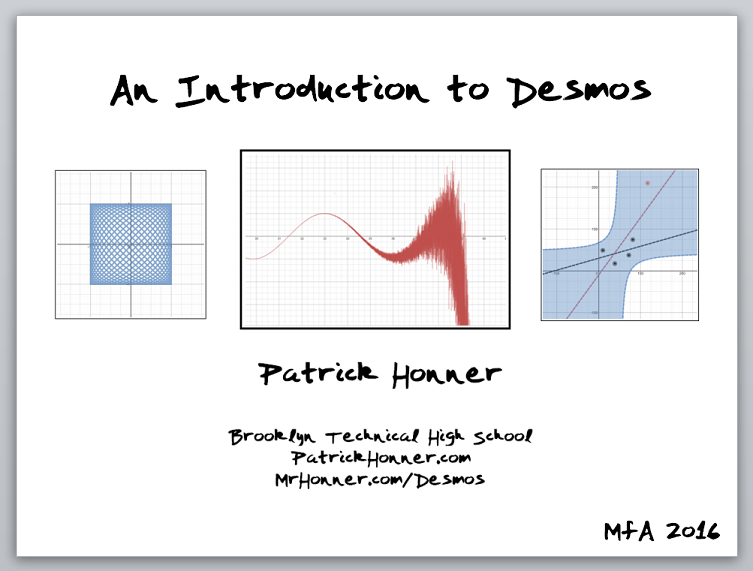
Participants began by working through a document I’ve put together that functions as a guided tour of Desmos.  I’ve used this document many times with both teachers and students:  it provides a quick overview of the power and breadth of the functionality of Desmos, and it allows me to circulate and answer, and ask, questions.  [You can find the document here: Introduction to Desmos]

The second part of the workshop had participants working on a series of content-specific challenges.  The goal was to use get teachers using Desmos to build mathematical objects.  For example, some teachers worked through these parabola challenges:

           Construct an arbitrary parabola
                  (a) with vertex (2,3)
                  (b) with vertex (x_1, y_1)
                  (c) with roots 2 and 3
                  (d) with roots r_1 and r_2 
                  (f) with focus (a,b) and directrix y = c

There were similarly structured challenges for LinesTransformations, Regions, and several other areas.  Participants could choose what to work on based on what they taught or what they were interested in.

As I circulated the room, I answered lots of good questions.  And I listened in as teachers talked about how they were already using Desmos in their classrooms.  I was especially gratified to hear several teachers tell me that they learned something in the workshop that would have made yesterday’s lesson better.  It felt good to deliver immediate impact to my colleagues, and I’m excited to know that many teachers have already integrated Desmos into their instruction.

Throughout the workshop I emphasized that the real power of Desmos is not as a presentation tool, but as a creative tool.  I often describe Desmos as a mathematical makerspace:  a place where we can design and build using the tools and techniques of mathematics.  As teachers, it’s tempting to see Desmos primarily as a tool for demonstrating mathematics to our students, but it’s true power lies in how it can help us all, teachers and students alike, make mathematics.

You can find more of my work with Desmos here.  And you can see pictures of the workshop here.


2015 — Year in Review

I always enjoy taking time at the end of the year to review my blog. It’s a great way to reflect on what I did and what I was thinking about, and it always reminds me how busy the year was! And 2015 was definitely a busy year.

The Presidential Award

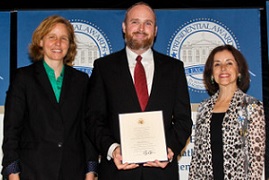
awards_PAEMSTWithout a doubt, the highlight of my professional year was being named a recipient of the Presidential Award for Excellence in Mathematics and Science Teaching (PAEMST).

I traveled to Washington, DC with other awardees to meet with representatives of the National Science Foundation, the National Academies of Science, and the Office of Science and Technology Policy. And the highlight of trip was meeting President Obama at the White House!

The trip to DC was part of an active professional summer.  I presented my paper “Monte Carlo Art” at this year’s Bridges Math and Art conference, and the following week I ran a fun workshop called “Games on Graphs” at the MOVES conference at the Museum of Mathematics. At the end of a very busy few weeks, I was surprised to find myself in this terrific New Yorker piece, “Cogito, Ergo, Summer” by Siobhan Roberts!

Speaking

In addition to presenting at Bridges and MOVES this summer, I traveled to Washington, DC earlier this year to speak at a policy briefing hosted by the Mathematical Sciences Research Institute (MSRI) during the first ever National Math Festival. I spoke about building the profession of math teachers, and was a bit intimidated to follow Nancy Pelosi, Harry Reid, and Al Franken! I also ran a variety of workshops on math and technology for teachers, and hosted Math for America’s 4th annual Master Teachers on Teaching, a great evening of talks from MfA Master Teachers.

Teaching

I always try to do new things in my classroom and my school, and 2015 was no exception. I’ve been having fun playing around with 3D-printing in a variety of classes, building demonstrations for geometric ideas, printing hard-to-imagine surfaces, and getting students creating with mathematics. I continue to develop and teach an integrated mathematics and computer science course, and I have taken on a part-time role as our department’s instructional coach.

Writing

For a variety of reasons I write less frequently than I used to, but I did surpass 1,000 total blog posts this past year! My work critiquing the New York State Regents exams continues to get attention,  and I was informally consulted for an excellent report by the Center for New York City Affairs about the serious issues facing New York state’s algebra exams that eventually caught the attention of the New York Times. And I continued my work with the New York Times Learning Network, contributing math lessons on evaluating compulsory retirement savings plans and asking students “Why Do Americans Stink at Math?”

So a great year comes to an end, but here’s hoping 2016 is just as challenging, productive, and rewarding!

Related Posts

Desmos

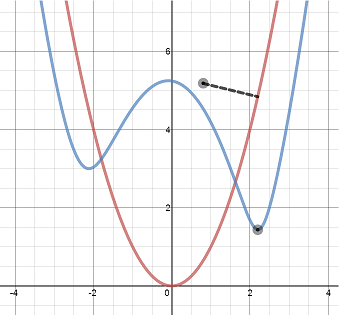
distance from a point to a graph

I employ Desmos, the free, web-based graphing calculator, in a variety of ways:  as a presentation platform, as a exploration environment, and as a tool for students to build with mathematics.

I have presented on Desmos many times, to teachers, administrators, and students.  You can read about one such workshop here.

And this document is part of my standard Introduction to Desmos workshop: Introduction to Desmos

Demonstrations

Here is a short list of some of the demonstrations I have created using Desmos.

Distance from a point to a graph  A nice visualization of the distance from a point to a graph.

Maximize the area of this rectangle!  A simple, engaging introduction to optimization.

The locus of points equidistant to a fixed point and a line segment  A visualization inspired by a James Tanton problem.

Distance from y = \sqrt{x} to the point (b,0)  The interactive that accompanies this neat little result.

Exploring Correlation and Regression  An interactive tool for exploring some elementary concepts in statistics.

Two Vectors Span the Plane  A visualization of linear independence.

Vector Derivatives  A demonstration of vector-valued functions and their derivatives

Circumcircle  The perpendicular bisectors of the sides of a triangle are concurrent at the circumcenter

When Technology Fails!  The interactive that spawned this fascinating conversation, and this talk.

PDFs and CDFs  A tool for building graphs of distribution and density functions.

MVT and Rolle’s Theorem  A demonstration of the connection between the Mean Value Theorem and Rolle’s Theorem.

Student Projects

Here are some example students projects using Desmos.

A variety of student projects from Fall 2015

Maximize the Area of the Corral

Lampost and Shadow

Maximize the Area of the Rectangle Inscribed in the Ellipse


For more examples, go to www.Desmos.com.

2015 Rosenthal Prize

momath logoThe Rosenthal Prize for Innovation in Math Teaching, presented by the Museum of Mathematics, aims to celebrate and promote the development of creative, engaging, and replicable math lessons.  The winning teacher receives $25,000, and their lesson is shared freely by the Museum of Mathematics.

Applications for the 2015 Rosenthal Prize are now open.  As a past awardee, I will be participating in an application workshop at the museum on Friday, May 1st.  The purpose of the workshop is to help teachers with the application process by answering questions and providing feedback.

The workshop details, including registration information, are available here.  For those unable to attend in person, the workshop will also be live-streamed.

I encourage interested teachers to consider applying for the Rosenthal Prize.  It’s a unique and interesting challenge, and just participating in the process can be a growth experience.

Follow

Get every new post delivered to your Inbox

Join other followers: