Math Lesson: Fantasy Football

My latest contribution to the New York Times Learning Network is a Math Lesson designed around a simple Fantasy Football-style game.

https://learning.blogs.nytimes.com/2011/10/26/put-me-in-coach-getting-in-the-quantitative-game-with-fantasy-football/

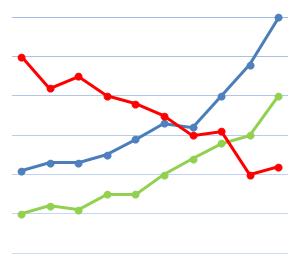
In this lesson, students use data, statistics, and a novel matchup metric to evaluate players and choose their teams.

As the results come in every week, students can refine their strategies and try to make more accurate projections!

Math Quiz: NYT Learning Network

Through Math for America, I am part of an on-going collaboration with the New York Times Learning Network.  My latest contribution, a Test Yourself quiz-question, can be found here:

https://learning.blogs.nytimes.com/2011/10/19/test-yourself-math-oct-19-2011/

This question is about the costs of providing  educational technologies, such as the math software Cognitive Tutor, to  students in the United States.

Math Quiz: NYT Learning Network

Through Math for America, I am part of an on-going collaboration with the New York Times Learning Network.  My latest contribution, a Test Yourself quiz-question, can be found here:

https://learning.blogs.nytimes.com/2011/10/03/test-yourself-math-oct-3-2011/

This question is based on Facebook’s claim that they have 800 million users, and asks “What percentage of the world’s population uses Facebook every day?”

Math Lesson: Analyzing Economic Measures in a Downturn

My latest contribution to the New York Times Learning Network is a math lesson built around gathering, representing, and analyzing economic indicator data.

https://learning.blogs.nytimes.com/2011/09/28/nowhere-to-go-but-up-analyzing-economic-measures-in-a-downturn/

By getting data on Real G.D.P., personal income, corporate profits, and unemployment from official sources like the Bureau of Economic Analysis and the U.S. Department of Labor, students explore positive and negative correlations between the various economic indicators.

In addition, students can explore the relationships between graphs of quantities and their rates of change by creating and comparing graphs of percent change.

Follow

Get every new post delivered to your Inbox

Join other followers: