Here is another installment in my series reviewing the NY State Regents exams in mathematics.
The Common Core Geometry standards emphasize a transformation-based approach to congruence and similarity. This is not a new mathematical idea, but it is novel in the context of traditional high school geometry.
How transformation-based geometry is assessed has been an on-going concern, and this question from the August 2015 Common Core Geometry exam highlights some of the mathematical concerns.
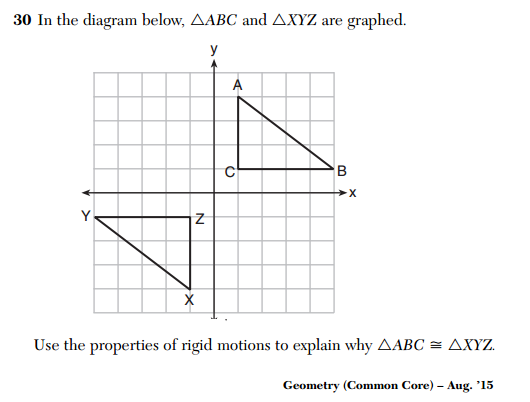
The student is supposed to argue that one of these triangles is the image of the other triangle under some rigid motion, and since rigid motions preserve length and angle, the image is congruent to the original.
But the following work samples, provided by New York State as examples of full-credit responses to this problem, demonstrate a serious lack of appreciation for the mathematics involved in this argument.
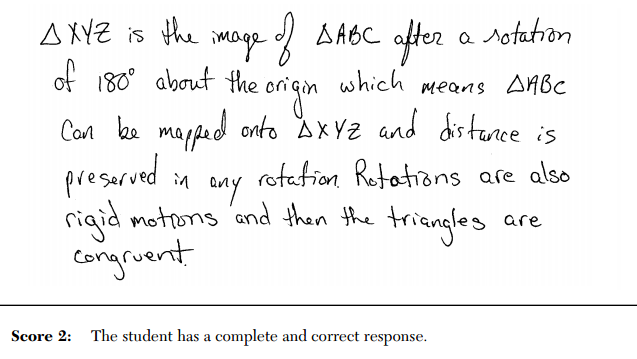
Notice that no attempt has been made to justify that a mapping that takes triangle ABC onto triangle XYZ exists, which is the foundation of this argument. The existence of such a mapping is merely stated as fact.
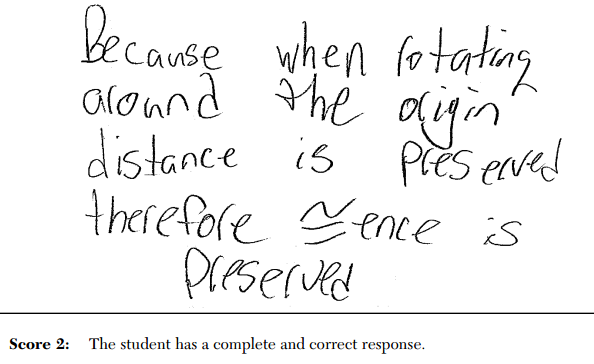
This full-credit response makes no reference to any specific triangle at all. It merely states a general property of rotation.
Ironically, the sample zero-credit response offered by the state is the most complete and rigorous response of all.
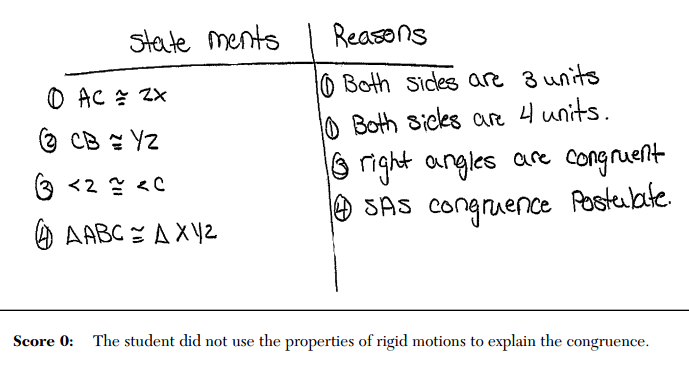
Here, the student has made a full, appropriate congruence argument, but receives no credit because they did not appeal to rigid motions.
I understand the desire to assess specific content and techniques, but in these sample response items, the state makes some curious decisions about who will be rewarded and who will be penalized. A student trained to simply regurgitate facts about rigid motions (“Rigid motions preserve distance”) is rewarded, while a student who actually attempts to solve the specific problem at hand, demonstrating depth of knowledge (and, perhaps, flexibility) in the process is penalized.
It’s not hard to imagine the consequences this can have on teaching and learning. These unintended, and typically unmentioned, consequences result from rushed policy implementation and over-emphasis on testing, and in many ways work to undermine the work of students and teachers.