Regents Recap — January 2015: Questions with No Correct Answer
Here is another installment in my series reviewing the NY State Regents exams in mathematics.
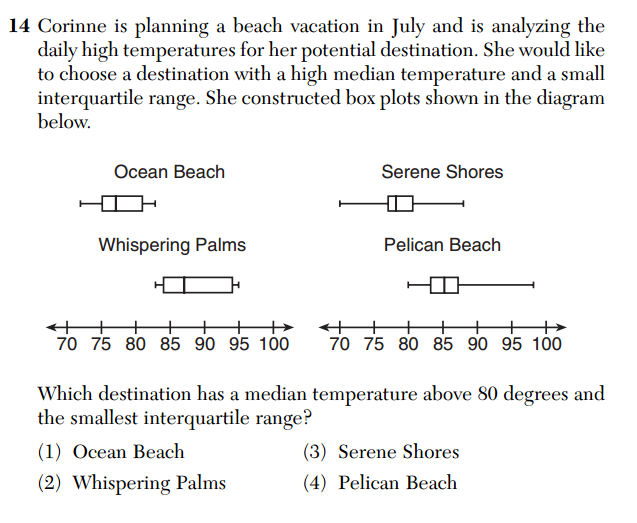
This is question 14 from the Common Core Algebra exam.
 Setting aside the excessive, and questionable, setup (do people really think about minimizing the interquartile range of daily temperatures when choosing vacation spots?), there is a serious issue with this question: it has no correct answer.
The student is asked to identify the data set that satisfies the following two conditions: median temperature over 80 and smallest interquartile range. No data set satisfies both these conditions. According to the diagram, the data associated with “Serene Shores” has the smallest interquartile range (represented by the width of the “box” in the box-and-whisker plot), but its median temperature (the vertical line segment in the box) is below 80.
The answer key says that (4) is the correct answer, but that data does not have the smallest interquartile range shown. Presumably, the intent was for students to evaluate a conditional statement, like, “Among those that satisfy condition A, which satisfies condition B?” But as written, the question asks, “which satisfies both condition A and condition B?” No set of data satisfies both.
Some may consider this nitpicking, but precision in language is an important part of doing mathematics. I focus on it in my classroom, and it is frustrating to see my work undermined by the very tests that are now being used to evaluate my job performance.
Moreover, this is by no means the only error present in these exams, nor is it the first example of errors in stating and evaluating compound sentences. If these exams don’t model exemplary mathematical practice, their credibility in evaluating the mathematical practice of students and teachers must be questioned.
1 Comment
Amy Hogan · April 22, 2015 at 5:32 pm
I was waiting for this one to show up here. In addition to the poor logic, there are more reasons why this is a bad question. For example, why are there two graphs provided? Inexplicably, in my opinion, since they have the same scale and are measuring the same variable. Students might get confused if they want them to compare two sets of two or all four or something else altogether. Why was it not possible to put the boxplots in one graph with one scale? (Or are we just supposed to be so overjoyed with the fact that a scale is actually provided?)