Regents Recap — June 2015: Cubics, Conversions, and Common Core

Here is another installment in my series reviewing the NY State Regents exams in mathematics.

One of the biggest differences between the new Common Core Regents exams and the old Regents exams in New York state are the conversion charts that turn raw scores into “scaled” scores.

The conversions for the new Common Core exams make it substantially more difficult for students to earn good scores.  The changes are particularly noticeable at the high end, where the notion of “Mastery” on New York’s state exams has been dramatically redefined.

Below is a graph showing raw versus scaled scores for the 2015 Common Core Algebra Regents exam.

NY Common Core Algebra Exam

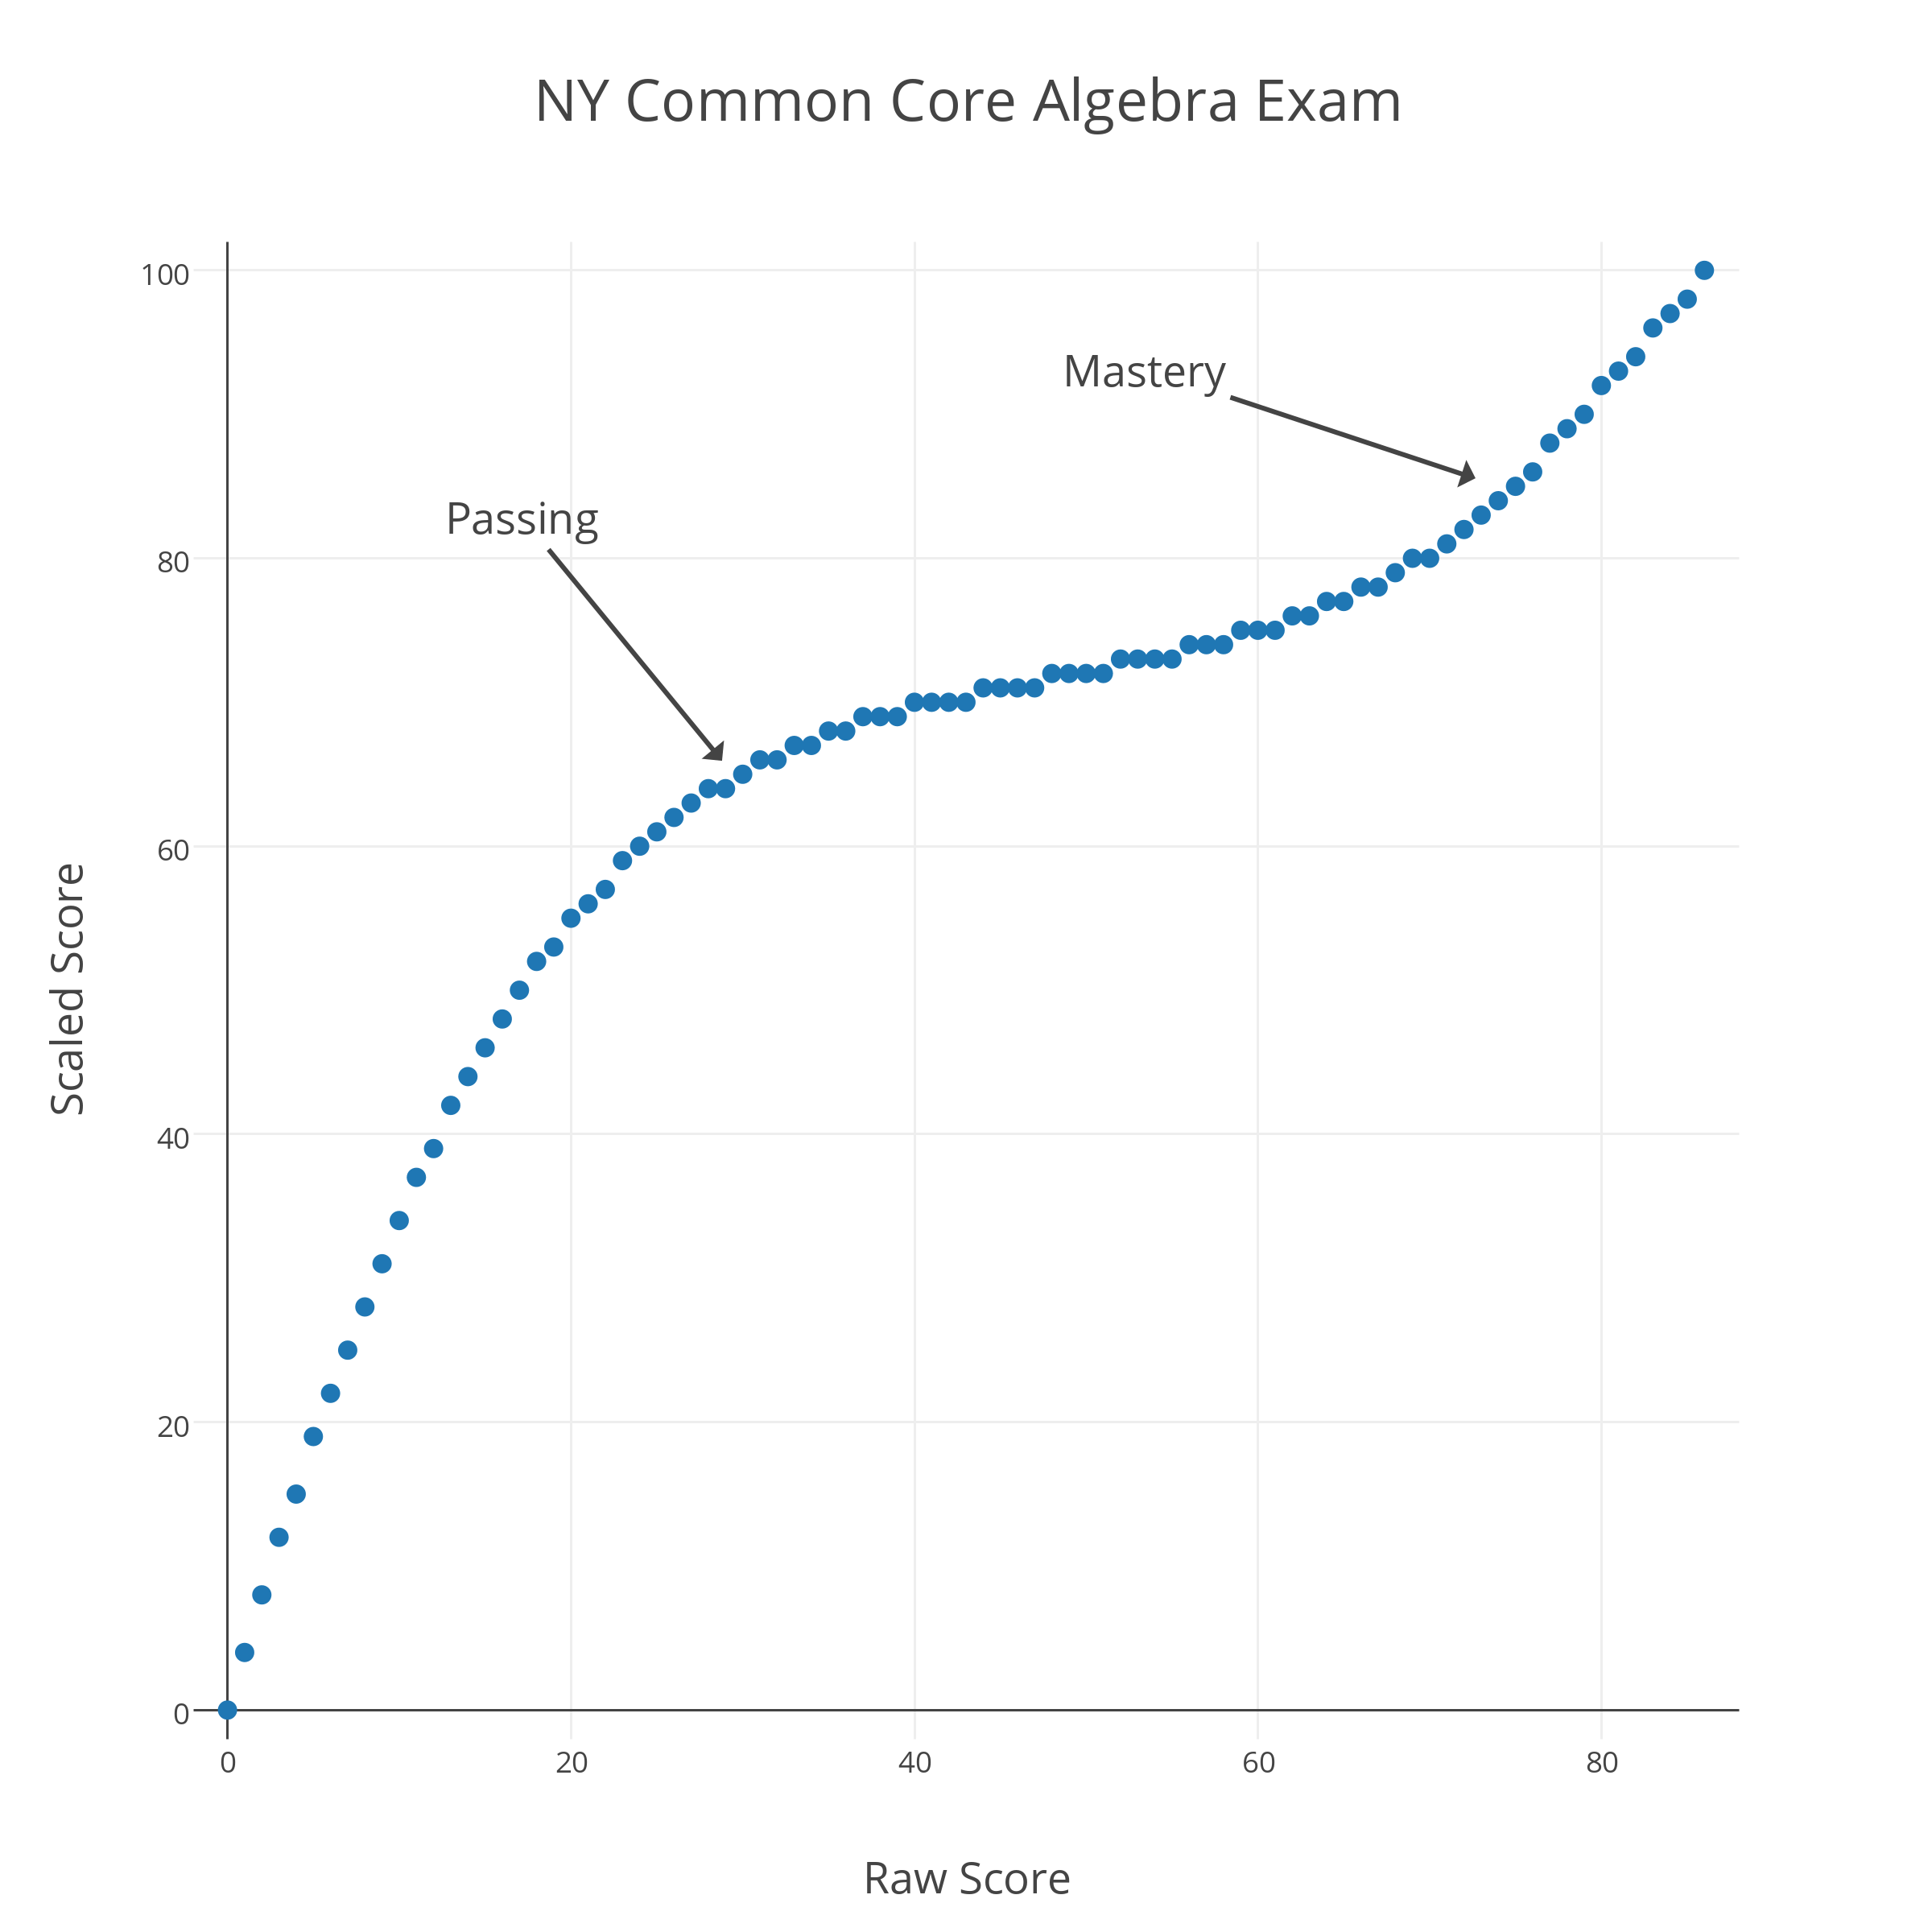
As with last year’s Common Core Algebra Regents exam, there is a remarkable contrast between “Passing” and “Mastery” scores.  To pass this exam (a 65 “scaled” score), a student must earn a raw score of 30 out of 86 (35%); to earn a “Mastery” score on this exam (an 85 “scaled” score), a student must earn a raw score of 75 out of 86 (87%).  It seems clear that the new conversions are designed to reduce the number of “Mastery” scores on these exams.

Another curious feature of this conversion chart is what happens at the upper end.  Consider the graph below, which shows the CC Algebra raw vs. scaled score in blue and a straight-percentage conversion (87% correct “scales” to an 87, for example) in orange.

NY Common Core Algebra Exam with Percentile

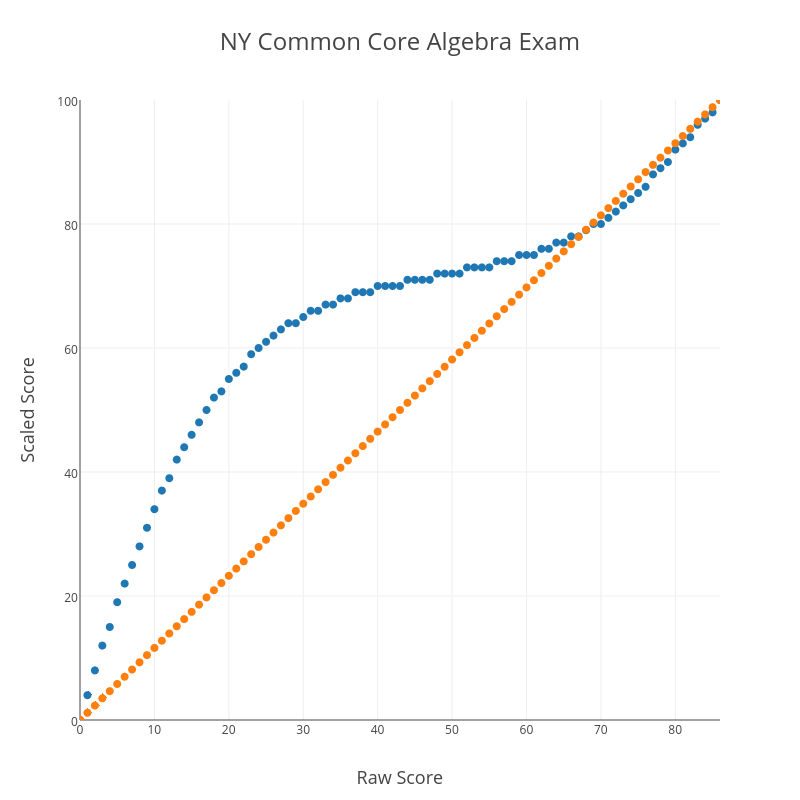
At the very high end, the blue conversion curve dips below the orange straight-percentage curve.  This means that, above a certain threshold, there is a negative curve for this exam!  For example, a student with a raw score of 82 has earned 95% of the available points, but actually receives a scaled score of less than 95 (a 94, in this case).  I suspect there are people who will claim expertise in these matters and argue that this makes sense for some reason, but it certainly doesn’t make common sense.

One final curiosity about this conversion.  It’s no accident that the blue plot of raw vs. scaled scores looks like a cubic function.

NY Common Core Algebra Exam cubic fit

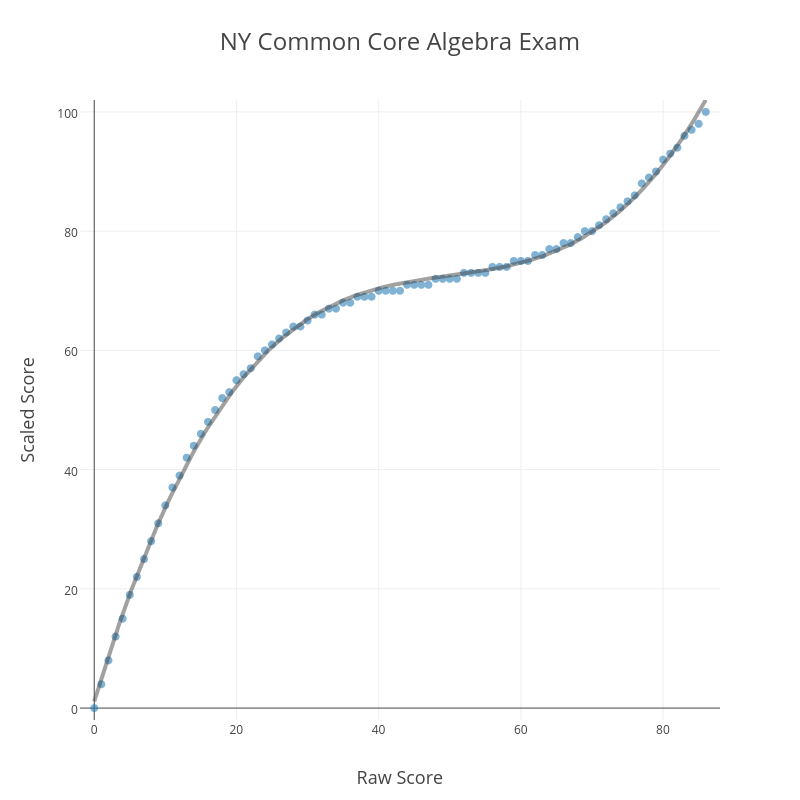
Running a cubic regression on the (raw score, scaled score) pairs yields

f(x) = 1.13 + 3.96x -0.076x^2 + .0005x^3

R^2 = 0.99

That is a remarkably strong correlation.  Clearly, those responsible for creating this conversion began with the assumption that the conversion should be modeled by a cubic function.  What is the justification for such an assumption?  It’s hard to believe this is anything but an arbitrary choice, made to produce the kinds of outcomes the testers know they want to see before the test is even administered.

These conversion charts are just one of many subtle ways these tests and their results can be manipulated.  Jonathan Halabi has detailed the recent history of such manipulations in a series of posts at his blog.  These are the kinds of things we should keep in mind when tests are described as objective measures of student learning.

Related Posts


Bridges Math and Art 2015

Bridges 2015I am excited to once again be participating in the Bridges Math and Art conference this summer!

The Bridges organization has been hosting this international conference highlighting the connections between art, mathematics, and computer science since 1994.

I have participated in several Bridges conferences, and my experiences there have greatly influenced me as a mathematician and a teacher.

This year, I’ll be presenting a short paper, “Monte Carlo Art Using Scratch“, chairing a short paper session, and exhibiting a photograph in the Bridges Mathematical Art Gallery.

You can view the Bridges 2015 program here, see the entire 2015 Art Exhibit here, and learn more about the conference and the Bridges organization here.

Related Posts

PAEMST

pres sealI am proud and excited to be named a recipient of the Presidential Award for Excellence in Mathematics and Science Teaching!

The Presidential Award is the highest honor presented by the federal government for K-12 mathematics and science teaching.  The awards are administered by the National Science Foundation on behalf of the White House and the Office of Science and Technology Policy.  A rigorous application process begins at the state level, and state finalists are evaluated by scientists and educators at the national level.

This is a tremendous individual honor, but it is also a testament to the collaboration and support of many wonderful colleagues across schools and professional organizations who continually help me grow and evolve as a teacher.  And to the students who challenge me every day to better challenge them.  And most importantly, to the unending support I receive at home, from my family.

Recipients of the Presidential Award gather in Washington, D.C. for a series of celebratory and professional events.  I’m looking forward to meeting a lot of inspiring teachers, and perhaps, the President!

The White House press release announcing the winners can be found here, and my PAEMST profile can be found here.

Math Photo: Circular Refraction

Circular Refraction

This simple exhibit at the New York Hall of Science demonstrates a lot of interesting trigonometry.  As the light hits the boundary of the semi-circular glass block, it bends back toward the central axis of the system.  I can’t look at this without seeing tangents, normals, and angles of incidence and refraction.  I wish I had brought my protractor!


Math Photo: Sorting Algorithms

Sorting Algorithms

One of our end-of-school tasks was breaking down all of our Zometool builds from the past year.  When a colleague handed me a bag of several hundred red, blue, and yellow struts, I immediately started to struggle and experiment with the most efficient ways to sort the struts for storage.

Should I take them out of the bag one at a time, placing each in its appropriate pile?  Or maybe a handful of ten at a time?  Or fifty?  Ultimately I settled on dumping them out and sliding them around into color-coordinated piles.  I’m not sure of the mathematical justification, but my internal optimizer seemed to think this was the right way to go.

Follow

Get every new post delivered to your Inbox

Join other followers: