While cleaning up after a successful group build, a colleague and some students had fun making a little Thanksgiving tribute in Zometool.

While cleaning up after a successful group build, a colleague and some students had fun making a little Thanksgiving tribute in Zometool.
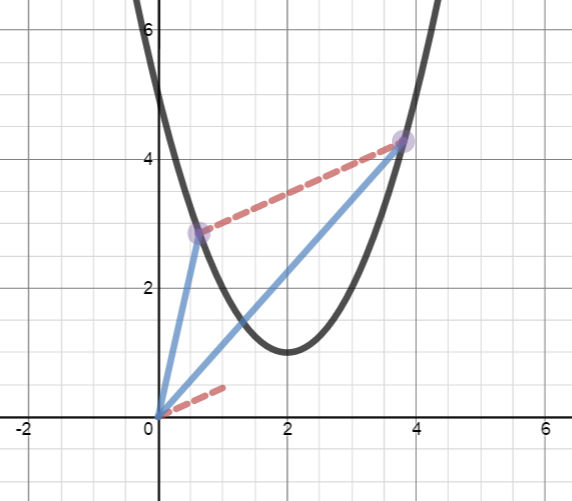 One way to think of a curve in the plane (or in space) is as a collection of terminal points of vectors whose initial points are all at the origin. The vectors are given by a vector-valued function.
For example, the parabola shown at right can be thought of as the graph of the vector-valued function
I’ve created a Desmos demonstration that shows how graphs of vector-valued functions are related to their vectors (shown in blue), and how the derivative of a vector-valued function is related to both difference vectors and tangent vectors. You can access the demonstration here.
You can find more of my Desmos demonstrations here.

I can’t look at this lovely jellyfish without seeing a four-petal rose curve in the polar plane.

My latest piece for the New York Times Learning Network is a lesson on the underlying mathematics of the spread of contagious diseases, like Ebola.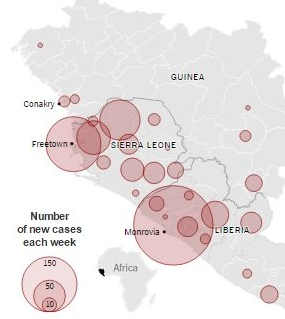
In this lesson, students use a basic exponential model to explore the fundamental mathematical ideas of transmission and replication.
Mathematically, the spread of disease can be modeled in a manner similar to the spread of a rumor. Although a number of simplifying assumptions must be made, the simple exponential model captures the basic impact of transmission rates on the dispersion of a disease among a population. Students can explore the consequences of transmission rate using multiplication, algebra, graphing utilities and elementary statistics.
After exploring the essential behavior of various simple exponential models, students then compare real-world data to their theoretical models. Those that are capable can perform regressions on the data to approximate actual transmission rates. The students’ work and the real-world data establish a context for discussing the strengths and weaknesses of this simple model of disease transmission.
This lesson is part of a series of Ebloa lessons at the NYT Learning Network and is freely available here.
I was playing around in Scratch this weekend, experimenting with some numerical methods for approximating integrals, when this lovely image unexpectedly emerged. I call it Twilight on Mars.

Twilight on Mars
Looks like I’ve got a new math and art project for students, and me, to explore!
