I am huge fan of Desmos, the free online graphing calculator. I use it almost every day in my classroom: to sketch simple graphs, demonstrate mathematical relationships, and dynamically explore mathematical situations. And like most worthy instructional technologies, it’s really a learning technology: it’s easily accessible to students as well as teachers..
As far as technology goes, Desmos works very well. But some of my favorite mathematical questions arise when technology does something we don’t expect.
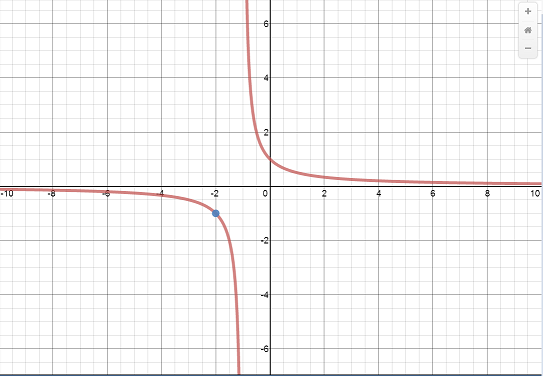
For example, here’s the graph of  . This graph has a hole (a removable discontinuity) at the point (-2,-1), which I have colored blue.

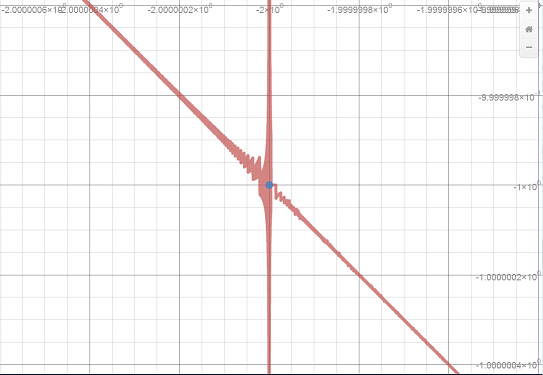
But look what happens when you zoom in around the hole:

At a very small scale, some very curious behavior emerges!
Now, it’s not the function here that’s behaving strangely: its behavior is well-understood. It’s the mathematical technology that is behaving strangely, as it tries to represent the function.
Lots of interesting questions emerge from such anomalies, and these are great questions for students to explore. In doing so, they’ll not only learn some mathematics and some computer science, but they’ll also develop a healthier relationship with technology, by learning to understand how it does what it does, and perhaps more importantly, what it doesn’t do. I explore this theme in greater depth in my talk “When Technology Fails“.
You can find more of my work with Desmos here.
Related Posts
 Through Math for America, I am part of an ongoing collaboration with the New York Times Learning Network. My latest contribution, a Test Yourself quiz-question, can be found here


