Using Infographics to Teach Math

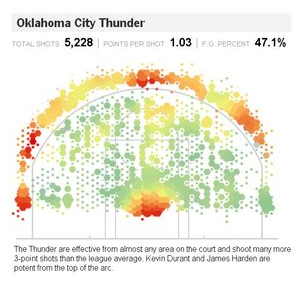
infographicsMy latest contribution to the New York Times Learning Network is a collection of ideas for using inforgraphics to explore mathematical concepts.

One activity has students look for ways in which graphs and graphics can be used to tell a particular side of a story.

Browse The Times with a critical eye. Think about the side of the story a given graph is being used to tell, and investigate how issues of interval and scale affect how the information is conveyed.  For example, in this Economix post, a graph is being used to show that unemployment is trending at a particular value, but the same graph with a different time interval makes the trend seem a little less significant.

The Times is full of beautiful representations of information, which create great opportunties for quantitative exploration, anaylsis, and discussion.  For more ideas, you can read the entire piece here.

12/30/2013 — Happy Derangement Day!

Today we celebrate a Derangement Day!  Usually I call days like today a permutation day because the digits of the day and month can be rearranged to form the year, but there’s something extra special about today’s date:

derangement day

The numbers of the month and day are a derangement of the year:  that is, they are a permutation of the digits of the year in which no digit remains in its original place!

Derangements pop up in some interesting places, and are connected to many rich mathematical ideas.   The question “How many derangements of n objects are there?” is a fun and classic application of the principle of inclusion-exclusion.  Derangements also figure in to some calculations of e and rook polynomials.

So enjoy Derangement Day!  Today, it’s ok to be totally out of order.

Follow

Get every new post delivered to your Inbox

Join other followers: