Regents Recap — June 2014: High School Statistics

Here is another installment in my series reviewing the NY State Regents exams in mathematics.

Elementary statistics plays an increasing role in high school math curricula, but the ways these concepts are often tested raises some concerns.  After all, the manner in which ideas are tested can reflect how the ideas are being taught.

Here’s a question from the 2014 Integrated Algebra exam:  which of the following is not a causal relationship?

2014 ia regents 27

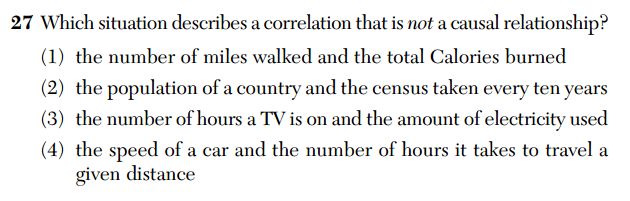
Causality is notoriously difficult to establish, but I’ll set aside my philosophical objections for the time being.  My primary concern here is with (2) being the correct answer.

First, correlation is a relationship between two quantities.  What quantity is population correlated with in answer choice (2)?  “The taking of the census” is an event, not a quantity.  This may seem like nitpicking, but what quantity are we supposed to assume in its place?  It seems natural to assume “the census taken” to mean “the number of people recorded on the census”, but then how could there be no causal relationship?  What causes a number to be written down for “population”, if not the actual population?

Here’s another question from the 2014 Integrated Algebra exam.

2014 ia regents 7

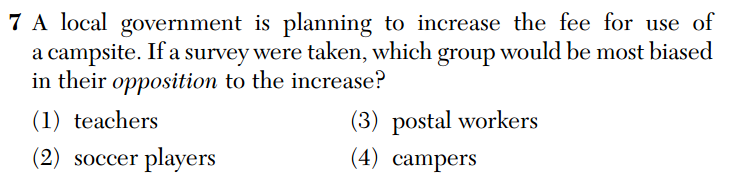
It’s important to talk about bias in surveys, but no substantial thought is required to answer this question:  three of the answer choices have absolutely nothing to do with campsites.  And for the record, the question should really be phrased like “which group is most likely to be biased against the increase?”.

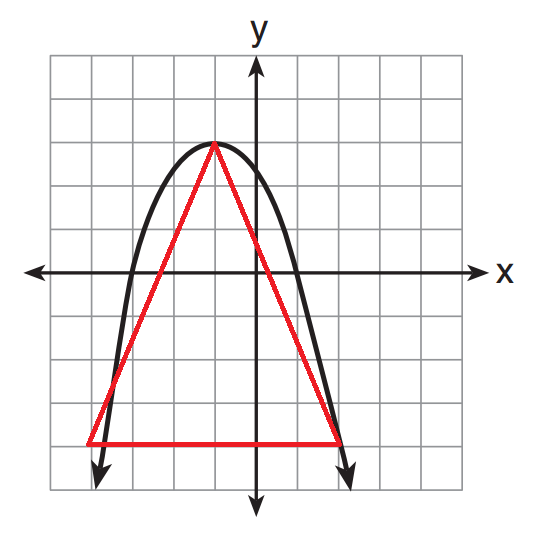
And this is a problem typical of the Algebra 2 / Trig exam.

2014 a2t regents 28I know it’s pretty much standard usage, but no finite data set can be normally distributed.  The correct terminology here would be something like “the heights can be approximated by the normal distribution”.

I’m aware that some may see these complaints as minor, but as I’ve argued before, I think it is extremely important to model precision and rigor in mathematical language for students.  We expect this from our teachers and our textbooks; we should expect it, too, from our tests.

Regents Recap — June 2014: These Are Not Parabolas

Here is another installment in my series reviewing the NY State Regents exams in mathematics.

I have written extensively about the unfaithful graphs presented on Regents exams:  non-trigonometric trig functions, non-exponential exponential functions, “functions” that intersect their vertical asymptotes multiple times.  I really don’t understand what is so hard about putting accurate graphs on tests.

Here is this year’s example.  These are some of the ugliest “parabolas” I have ever seen.  I can’t look at these without being mathematically offended.

regents 2014 -- ugly parabolas

Not one of these graphs are parabolas.  Take a closer look at (3), by far the ugliest purported parabola.  Look at how unparabolic this is.  It lacks symmetry, and appears to turn into a line at one point!

the ugliest parabola

If this were truly a parabola, we would be able to fit an isosceles triangle inside with vertex on vertex.

the ugliest parabola plus triangle

Not even close!

It’s a fun exercise to show that the others can’t possibly be parabolas either, which I will leave as to the reader.

Related Posts

Math Photo: Change of Coordinates

Change of Coordinates

Shining through the rectangular grid of chain links, the sun creates a second, compressed coordinate system in shadow.  This reminds me of changing coordinate systems, as in linear algebra or a u-du substitution .

Often, a new coordinate system can provide a cleaner environment for solving a problem.  And as long as we understand the transformation that got us there, we can usually take our solution back with us when we return.

Regents Recap — June 2014: Which Graph is Steeper?

Here is another installment in my series reviewing the NY State Regents exams in mathematics.

The following question appeared on the June, 2014 Algebra 2 / Trig exam. Regents 2014 -- which graph is steeperTo start, steeper is not a well-defined term, not in an Algebra 2 / Trig class, anyway.  I’m not against using the word in everyday mathematics conversations, but I’m not a fan of putting it on an official exam like this.  After all, I think these exams should model exemplary mathematical behavior.  But that’s not the real issue here.

Even if we accept what steeper means, it can not be said that either graph is steeper than the other. Take a look:  here, y = 2^{x} is graphed in red and y = 5^{x} is graphed in blue.

steeper graphs

It seems pretty clear that the blue graph is steeper than the red on the right hand side, it also seems pretty clear that the red graph is steeper off to the left.

To be precise, the derivative of y = 2^{x} is greater than the derivative of y = 5^{x} for x < \frac{ln(\frac{ln5}{ln2}}{ln(2) - ln(5)} \approx -0.9194
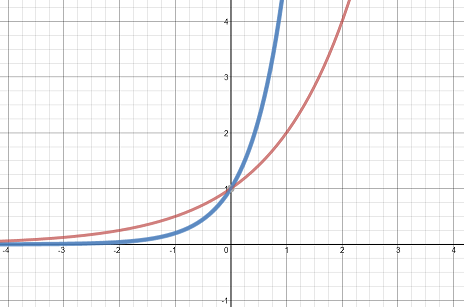
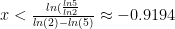
, thus making the red graph steeper for those values of x.

Thus, there really is no correct answer to this question.  The answer key originally had (3) as the correct answer, but it is no truer than (2).  Ultimately, a correction was issued for the problem, and both (2) and (3) were awarded full credit.

Mistakes are bound to happen when writing exams, and it’s good that a correction was ultimately issued.  But this is a pretty obvious error.  This question should not have made its way onto a high-stakes exam taken by tens of thousands of students.  A thoughtful student might have been frustrated, confused, or disheartened confronting this question with no correct answer.  Hopefully its impact didn’t extend beyond these two points.

Regents Recap — June 2014: What is an “Absolute Value Equation”?

Here is another installment in my series reviewing the NY State Regents exams in mathematics.

The following question appeared on the 2014 Integrated Algebra exam.

2014 ia regents 23My question is this:  what, exactly, is an “absolute value equation”?  According to the scoring key, the correct answer to this question is (2).  This suggests that the exam writers believe an “absolute value equation” to be some transformation of y = |x|.

But “absolute value equation” is not a precise description of what the exam writers seem to be looking for.  It would be hard to argue that y = |2b^{x}| is not an “absolute value equation”, but that appears to be the graph depicted in (1).  With some work, all the given graphs could be represented as equations involving absolute values (an exercise left to the reader).

I doubt this imprecision caused any student to get this question wrong, but as I have argued again and again, these exams should stand as exemplars of mathematical precision.  These exams should not model imprecise language, poor notation, and improper terminology.  We do our students a great disservice by constantly asking them to guess what the exam writers were trying to say.

Follow

Get every new post delivered to your Inbox

Join other followers: