This sculpture is by David H Press. You can find out more about his work here.
This is another piece from the 2013 Bridges Mathematical Art Gallery.
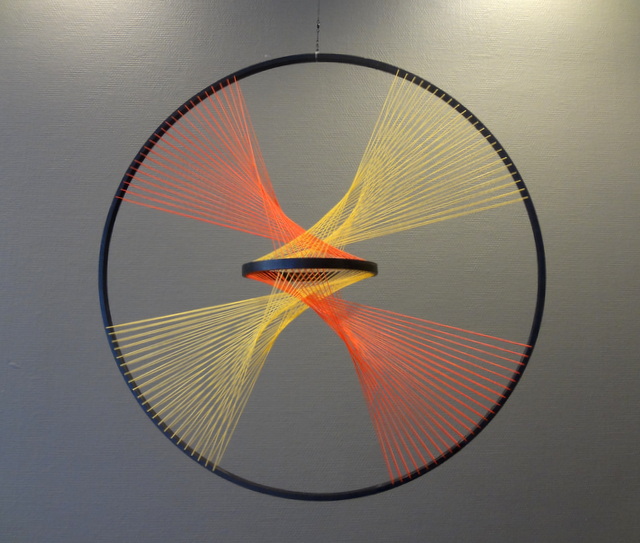
This sculpture is by David H Press. You can find out more about his work here.
This is another piece from the 2013 Bridges Mathematical Art Gallery.
I am huge fan of Desmos, the free online graphing calculator. I use it almost every day in my classroom: to sketch simple graphs, demonstrate mathematical relationships, and dynamically explore mathematical situations. And like most worthy instructional technologies, it’s really a learning technology: it’s easily accessible to students as well as teachers..
As far as technology goes, Desmos works very well. But some of my favorite mathematical questions arise when technology does something we don’t expect.
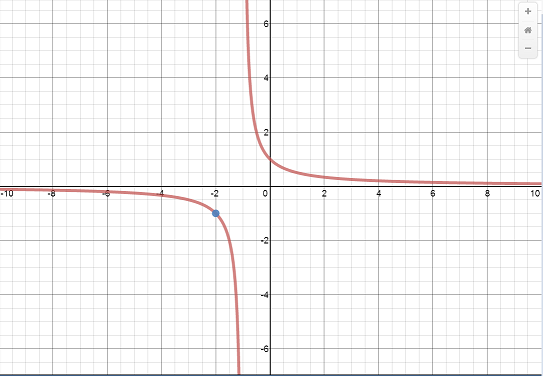
For example, here’s the graph of 
But look what happens when you zoom in around the hole:
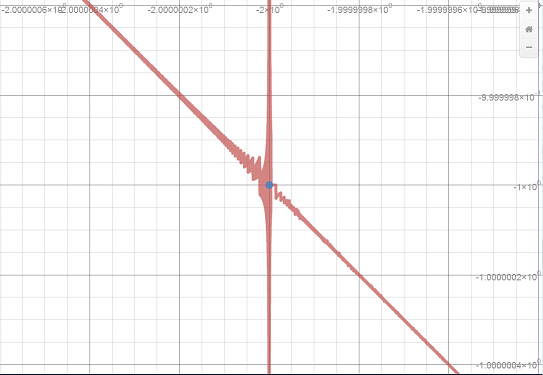
At a very small scale, some very curious behavior emerges!
Now, it’s not the function here that’s behaving strangely: its behavior is well-understood. It’s the mathematical technology that is behaving strangely, as it tries to represent the function.
Lots of interesting questions emerge from such anomalies, and these are great questions for students to explore. In doing so, they’ll not only learn some mathematics and some computer science, but they’ll also develop a healthier relationship with technology, by learning to understand how it does what it does, and perhaps more importantly, what it doesn’t do. I explore this theme in greater depth in my talk “When Technology Fails“.
You can find more of my work with Desmos here.
Related Posts
 I am excited to once again be participating in the TIME 2000 conference at Queens College.
This conference showcases the TIME 2000 program at Queen’s College, which supports undergraduate students in studying mathematics and math education. I will be running a workshop on the geometry of folding and cutting. James Tanton–mathematician, teacher, and creator of fantastic mathematical challenges–will be giving the keynote address.
The conference is Friday, November 22nd, and is open to high school students who are considering mathematics education as a possible career.
 Through Math for America, I am part of an ongoing collaboration with the New York Times Learning Network. My latest contribution, a Test Yourself quiz-question, can be found here
Test Yourself Math — November 13, 2013
This question deals with the Common App, an online system that processes millions of college applications every year. What is the average number of applications processed per college?
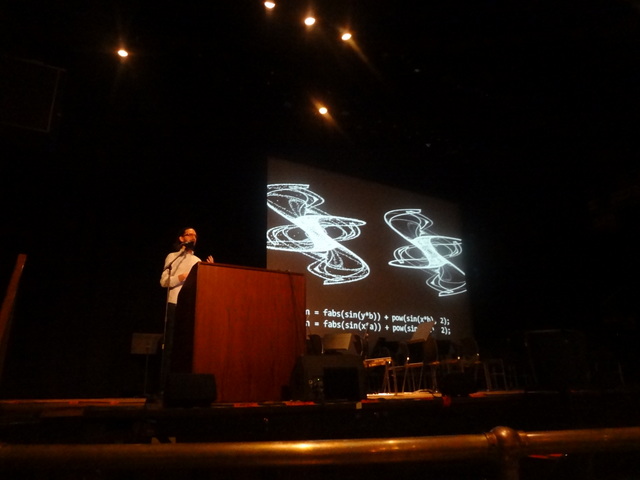 We recently hosted artist and computer programmer Nathan Selikoff at our school, and he spoke to our students about art, mathematics, and technology.
Nathan Selikoff is an award-wining artist and an organizer of the Bridges Math and Art conference. In his talk, “Art, Chaos, and Computation”, Nathan provided an engaging overview of the history of computation in art while talking about his personal experiences conceiving and creating mathematical art.
The talk left quite an impression on our students, many of whom were not aware that mathematicians and computer scientists could also be artists. Students left the talk interested in experimenting with their own mathematical creations, and they were excited to play with the programs the artist generously provided.
A few student quotes nicely summarize the impact of the talk:
It made me want to learn more about the codes and the mathematical equations that make up the paradoxes of the chaotic art pieces.
This really makes me wonder about the extent of art that can be created. I’m curious to find out what I’ll be able to program.
The talk inspired me to create my own art with math equations.
Thanks to the artist for such a great visit! You can find out more about Nathan Selikoff here. And be sure to check out the Bridges Math and Art conference.