Regents Recap — June 2014: Common Core Content

Here is another installment in my series reviewing the NY State Regents exams in mathematics.

June, 2014 saw the administration of the first official Common Core Regents exam in New York state,  Algebra I (Common Core).  Roughly speaking, this exam replaces the Integrated Algebra Regents exam, which is the first of the three high school level math Regents exams in New York.

So how does the new Algebra I (Common Core) exam compare with the old Integrated Algebra exam?  In terms of mathematical content, one difference jumps out immediately:  functions.

On the 2014 Algebra I (Common Core) exam, the word “function” appears 17 times.  On the 2014 Integrated Algebra exam, the word “function” appears once.

An informal reading indicates that functions play a part in 14 of the Algebra I (Common Core) exam questions, which are worth a total of 36 points.   This is around 42% of the exam (36/86 points).  In addition to several direct, function-related questions, like about domains and modeling, we see a number of familiar questions recast in the language of functions.

For example, number 12 from the Algebra I (Common Core) exam asks about “zeros of the function”.  On an Integrated Algebra exam, the same type of question would likely have been asked in the context of “solving an equation”.

common core -- functionI’m not going to dispute the importance of this concept:  functions are central objects in mathematics, and in high school math in particular.  But this is clearly a substantial change in focus for this exam, and I doubt many could have predicted the extent of this change.  Functions should be covered in any algebra course, but this dramatic shift in assessment undoubtedly penalized many students.  A student with a weak grasp on this one concept would face a huge obstacle on the Algebra I (Common Core) exam.

In addition to this major shift in emphasis, several topics which were previously covered in the highest-level exam (Algebra 2 / Trig)  are now on the Algebra I (Common Core) exam:  recursively defined functions; correlation coefficient; and the quadratic formula.  This does not come as a surprise, but it’s worth noting that these topics have been moved ahead by 2-3 years in the typical student sequence.  Also of note was that students were asked to factor a fourth-degree polynomial (of quadratic type) on the Algebra I (Common Core) exam, which as far as I know has only previously appeared on the Algebra 2 / Trig exam.

Will the next iteration of Algebra I (Common Core) emphasize functions so heavily?  What will the first iteration of Geometry (Common Core) exams look like?  Our initial experience with Common Core Regents exams in New York suggest it will be hard to predict.

Regents Recap — June 2014: Subtle Changes

Here is another installment in my series reviewing the NY State Regents exams in mathematics.

The following item appeared on the 2014 Geometry exam.  It was the highest-valued item on the exam, the only six-point question.

2014 Regents Geom -- coordinate proof

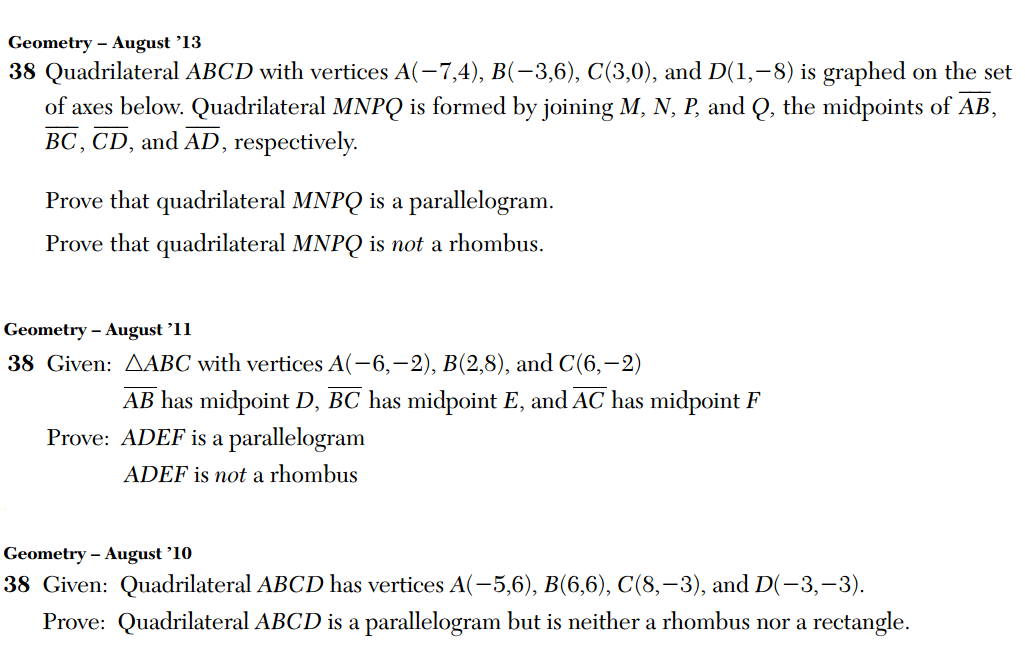
There’s nothing particularly unusual about this problem.  In fact, similar problems have appeared on prior exams.  Here we see the lone six-point problems from the 2013, 2011, and 2010 Geometry exams.

other six-point geom questions

The problems are all very similar, yet there is one subtle difference between the 2014 version and these three prior versions:  the 2014 version contains one less substantial task than the three previous versions.  That is, it requires less work than previous versions, but is still worth six points.

In 2014, the student is asked to prove that a given quadrilateral is a parallelogram, but not a rhombus.  In 2010, the student had to do these two things, but in addition prove that the quadrilateral wasn’t a rectangle.

In 2013 and 2011, the student was asked to prove two similar results, but first had to construct a new quadrilateral from the given quadrilateral.  This preliminary work involves repeated application of the midpoint formula.

I don’t really think this is a big deal, but it does point to the subtle ways in which tests, scores, and results can be manipulated.  Test results have become highly politicized in recent times:  politicians routinely take credit for improving graduation rates and closing achievement gaps.  But without scrutiny of the tests themselves–their content, their construction, their scoring–it’s difficult to put such claims in their proper perspective.

Regents Recap — June 2014: Are They Reading?

Here is another installment in my series reviewing the NY State Regents exams in mathematics.

I have been reviewing New York State Math Regents exams for several years now, and I occasionally wonder if anyone involved in the production of the exams pays attention to what I say.

Well, last year I wrote about a problem on the Geometry exam that asked students to graph a compound locus but then incorrectly penalized them if they didn’t graph each individual locus.  The supervisor at the grading site didn’t take our complaints seriously, but It seems the exam authors eventually realized that this was wrong.

This is from the 2014 Geometry exam.

2014 Regents Geom -- locus

Notice how this question explicitly asks the student to graph both individual loci.

I doubt that my post instigated the change, but it is nice to see errors on these exams addressed every once in a while.

Regents Recap — June 2014: Lack of Scale

Here is another installment in my series reviewing the NY State Regents exams in mathematics.

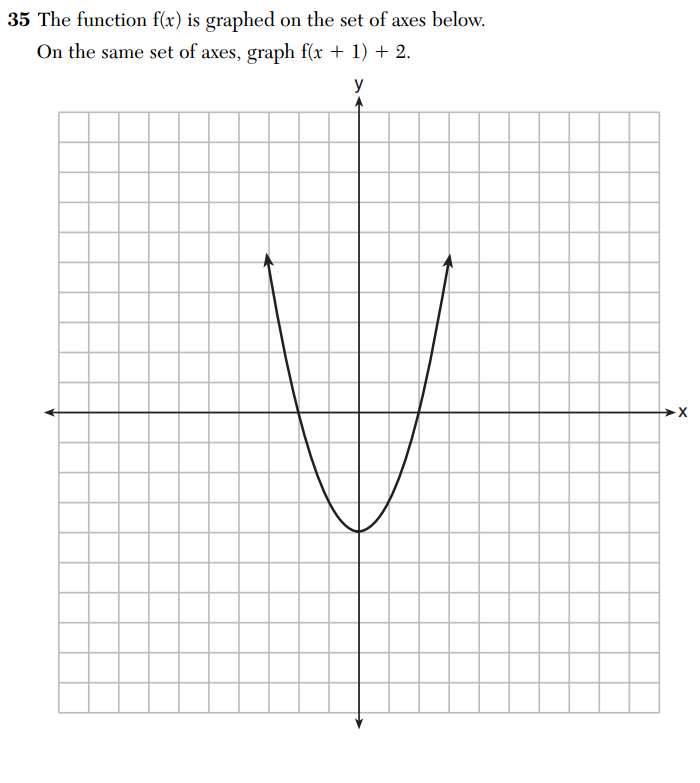
The following question appeared on the June, 2014 Algebra 2 / Trig exam.

2014 alg 2 trig 35 -- lack of scaleGraphs without scales are common on Regents exams (I’ve written about this before).  Personally, it’s not a huge deal to me–I’m a lazy grapher, myself.  However, a colleague of mine regularly complains about this, and she made an excellent point regarding the grading of this particular problem.

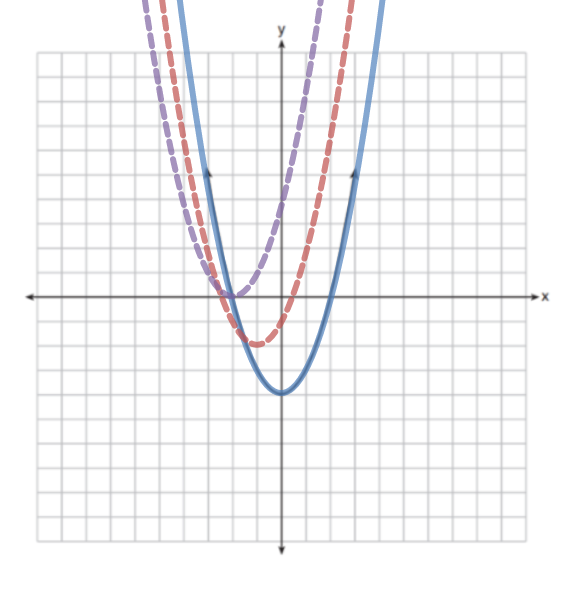
The solution to this problem involves translating the graph one-unit to the left and two units up.  But since no scale is given on the graph, it’s not clear what one unit to the left would be.  If we assume the box on the graph indicates one unit, then the red graph below would be appropriate.  But if we assume a box to represent half-a-unit, the purple graph would be correct.

unscaled graphs -- possibilitiesIf no scale is explicitly given, it seems like both graphs should be considered correct and receive full credit.  But the rubric doesn’t address this possibility, and it’s unlikely students were given the benefit of the doubt.

Regents Recap — June 2014: High School Statistics

Here is another installment in my series reviewing the NY State Regents exams in mathematics.

Elementary statistics plays an increasing role in high school math curricula, but the ways these concepts are often tested raises some concerns.  After all, the manner in which ideas are tested can reflect how the ideas are being taught.

Here’s a question from the 2014 Integrated Algebra exam:  which of the following is not a causal relationship?

2014 ia regents 27

Causality is notoriously difficult to establish, but I’ll set aside my philosophical objections for the time being.  My primary concern here is with (2) being the correct answer.

First, correlation is a relationship between two quantities.  What quantity is population correlated with in answer choice (2)?  “The taking of the census” is an event, not a quantity.  This may seem like nitpicking, but what quantity are we supposed to assume in its place?  It seems natural to assume “the census taken” to mean “the number of people recorded on the census”, but then how could there be no causal relationship?  What causes a number to be written down for “population”, if not the actual population?

Here’s another question from the 2014 Integrated Algebra exam.

2014 ia regents 7

It’s important to talk about bias in surveys, but no substantial thought is required to answer this question:  three of the answer choices have absolutely nothing to do with campsites.  And for the record, the question should really be phrased like “which group is most likely to be biased against the increase?”.

And this is a problem typical of the Algebra 2 / Trig exam.

2014 a2t regents 28I know it’s pretty much standard usage, but no finite data set can be normally distributed.  The correct terminology here would be something like “the heights can be approximated by the normal distribution”.

I’m aware that some may see these complaints as minor, but as I’ve argued before, I think it is extremely important to model precision and rigor in mathematical language for students.  We expect this from our teachers and our textbooks; we should expect it, too, from our tests.

Follow

Get every new post delivered to your Inbox

Join other followers: