No Confidence in Testing Inference on the Regents Exam
Students are learning more statistics in high school math courses than ever before, which is great: statistical literacy is essential to life in the modern world. But statistical techniques are subtle, and must be taught and tested carefully. To that point, consider question 35 from the June 2022 Algebra 2 Regents exam, which involves the important but tricky concept of statistical inference.
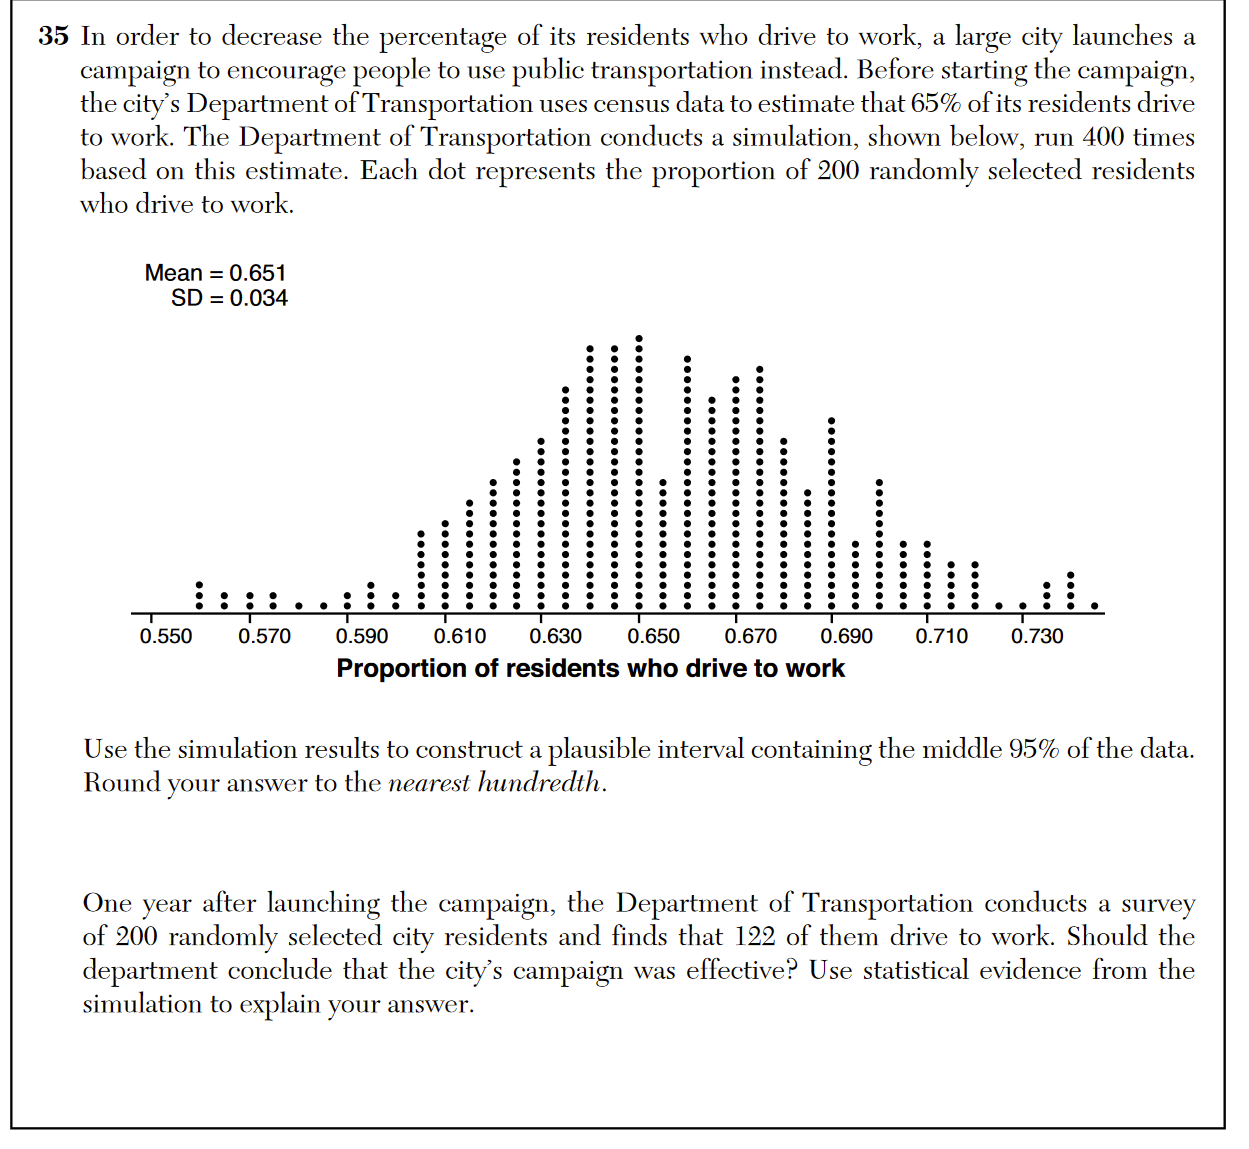
The set up of the problem establishes that 65% of a city’s residents drive to work, and an intervention hopes to reduce that percentage. The ultimate question is this: After the intervention, is a random sample of residents in which 61% drive to work evidence that the intervention was successful?
In order to establish the context for making an inference, a dot plot of sample proportions from simulated samples is shown. The trouble begins with the student directive:
“Construct a plausible interval containing the middle 95% of the data.”
What is meant by “the data” here? Does this refer to the simulation data? Because if so, that wouldn’t make sense. You don’t need to construct a “plausible interval” that contains 95% of the simulation data. It’s all right there. You can construct an exact interval that contains 95% of the data.
You don’t want an interval that contains “the data”. What you want is an the interval that contains the central 95% of the sampling distribution of sample proportions, a theoretical distribution used in making inferences. This interval in the sampling distribution can be constructed using the mean and standard deviation of an individual sample, because in the case of sample proportions the mean and standard deviation of a sample can be used to estimate the mean and standard deviation of the sampling distribution itself.
Drawing inferences using statistics is subtle, and vaguely referring to “the data” confuses and obscures the important details of the process. I spent a lot of time trying to clearly build these ideas up in my book Painless Statistics precisely because I don’t think most students and math teachers, many of whom are now occasional statistics teachers, really understand the connection between sampling distributions, estimators, and inference making. As evidence of that, consider this student response.
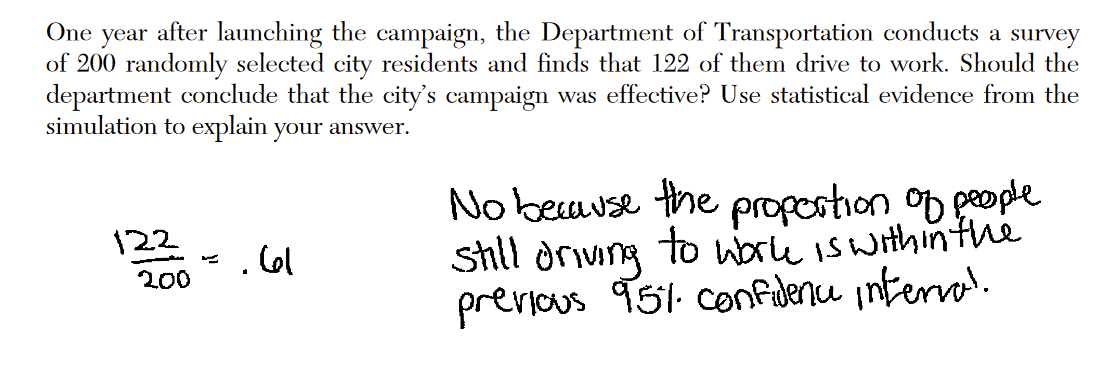
The student refers to the interval they’ve constructed as a “confidence interval”. While similar in structure, this is not a confidence interval: a confidence interval is used to estimate an unknown population parameter, which is not what is happening here (the population proportion has already been estimated to be 65%). The fact that this student received full credit for this response suggests there are probably more than a few math teachers out there who also think this is a confidence interval. (At least they aren’t saying a 95% confidence interval means they are 95% confident of their results, as they have done before.)
It’s good that more students are learning more statistics, but in order to teach and learn statistics properly we can’t have our standardized tests working against us.
Related Posts
0 Comments