I suppose it makes sense to use polar coordinates to map the sky if you’re an anti-aircraft gunner.
This interesting application of mathematics is brought to you by the USS Intrepid.
Thanks to the strong presence of mathematicians and math teachers on social media, I know I’m not the only person who, when sitting around with a box full of compasses, unexpectedly ends up doing things like this.
A circle made of circle-makers! Or, from another perspective, a regular 26-sided polygon.
The fact that I created an object that doesn’t even appear to have a name made me feel a little better about this use of time.
Every fall, Math for America celebrates the great work of their math and science teachers with a gala dinner. In addition to food, drinks, and talks from teachers, leaders, and policy makers, the event always features math puzzles to ponder while enjoying the evening’s festivities.
 Here is one of this year’s puzzles:
Suppose you are standing several miles from the Pentagon. What is the probability you can see three sides of the building?
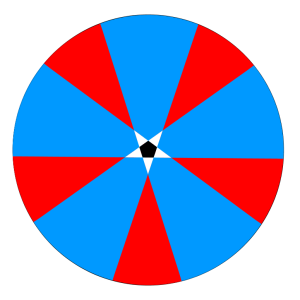
This is a fairly well-known puzzle with a seemingly straight-forward answer. Consider the diagram at right.
The pentagon is shown in black, at the center. Shown in white are the regions where only one side is visible; the regions where only two sides are visible are blue; and the regions where three sides are visible are red.
A simple “solution” is as follows. An infinite red region is essentially equal in area to an infinite blue region, as they differ only by a finite amount: namely, the pentagon itself and three white triangles. So from the perspective of the infinite plane, all finite regions are negligible, and the blue and red areas are equal. Thus, there is a 50% chance you’ll see two sides, and a 50% chance you’ll see three sides.
This is the argument that some colleagues gave, and it is a nice one. However, there’s a slight problem: as stated, the puzzle didn’t suggest that the vantage point was a randomly selected point in the plane. It suggested that the vantage point was a randomly selected point at a fixed distance from the pentagon!
At any finite distance from the pentagon, say D, you are more likely to see two sides than three! As D goes to infinity, the probabilities converge to one-half, but at any finite distance, the blue regions are always slightly larger than the red regions.
To illustrate this point, I created the following animation in Geogebra. At small radii, the blue regions clearly occupy more area than the red regions, but as the radius increases, the respective areas start tend to converge.
So, not only was this a fun puzzle to think about, but it became an object lesson in how important the statement of the problem can be. And in particular, it’s a reminder of how the different ways we model random selection can make for big differences in our solutions!
Happy Right Triangle Day!
Today, on 12/9/15, we celebrate a favorite triangle: the 9-12-15 right triangle.
We know this triangle is right because the side lengths satisfy the Pythagorean Theorem.
We just recently celebrated this right triangle, but it will be a while before the date suggests another. So, enjoy being right today!