Desmos
I employ Desmos, the free, web-based graphing calculator, in a variety of ways: as a presentation platform, as a exploration environment, and as a tool for students to build with mathematics.
I have presented on Desmos many times, to teachers, administrators, and students. You can read about one such workshop here.
And this document is part of my standard Introduction to Desmos workshop: Introduction to Desmos
Demonstrations
Here is a short list of some of the demonstrations I have created using Desmos.
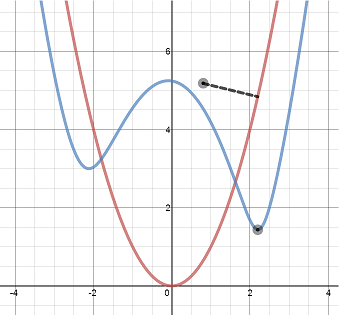
Distance from a point to a graph A nice visualization of the distance from a point to a graph.
Maximize the area of this rectangle! A simple, engaging introduction to optimization.
The locus of points equidistant to a fixed point and a line segment A visualization inspired by a James Tanton problem.
Distance from 
Exploring Correlation and Regression An interactive tool for exploring some elementary concepts in statistics.
Two Vectors Span the Plane A visualization of linear independence.
Vector Derivatives A demonstration of vector-valued functions and their derivatives
Circumcircle The perpendicular bisectors of the sides of a triangle are concurrent at the circumcenter
When Technology Fails! The interactive that spawned this fascinating conversation, and this talk.
PDFs and CDFs A tool for building graphs of distribution and density functions.
MVT and Rolle’s Theorem A demonstration of the connection between the Mean Value Theorem and Rolle’s Theorem.
Student Projects
Here are some example students projects using Desmos.
A variety of student projects from Fall 2015
Maximize the Area of the Corral
Maximize the Area of the Rectangle Inscribed in the Ellipse
For more examples, go to www.Desmos.com.