2015 — Year in Review

I always enjoy taking time at the end of the year to review my blog. It’s a great way to reflect on what I did and what I was thinking about, and it always reminds me how busy the year was! And 2015 was definitely a busy year.

The Presidential Award

awards_PAEMSTWithout a doubt, the highlight of my professional year was being named a recipient of the Presidential Award for Excellence in Mathematics and Science Teaching (PAEMST).

I traveled to Washington, DC with other awardees to meet with representatives of the National Science Foundation, the National Academies of Science, and the Office of Science and Technology Policy. And the highlight of trip was meeting President Obama at the White House!

The trip to DC was part of an active professional summer.  I presented my paper “Monte Carlo Art” at this year’s Bridges Math and Art conference, and the following week I ran a fun workshop called “Games on Graphs” at the MOVES conference at the Museum of Mathematics. At the end of a very busy few weeks, I was surprised to find myself in this terrific New Yorker piece, “Cogito, Ergo, Summer” by Siobhan Roberts!

Speaking

In addition to presenting at Bridges and MOVES this summer, I traveled to Washington, DC earlier this year to speak at a policy briefing hosted by the Mathematical Sciences Research Institute (MSRI) during the first ever National Math Festival. I spoke about building the profession of math teachers, and was a bit intimidated to follow Nancy Pelosi, Harry Reid, and Al Franken! I also ran a variety of workshops on math and technology for teachers, and hosted Math for America’s 4th annual Master Teachers on Teaching, a great evening of talks from MfA Master Teachers.

Teaching

I always try to do new things in my classroom and my school, and 2015 was no exception. I’ve been having fun playing around with 3D-printing in a variety of classes, building demonstrations for geometric ideas, printing hard-to-imagine surfaces, and getting students creating with mathematics. I continue to develop and teach an integrated mathematics and computer science course, and I have taken on a part-time role as our department’s instructional coach.

Writing

For a variety of reasons I write less frequently than I used to, but I did surpass 1,000 total blog posts this past year! My work critiquing the New York State Regents exams continues to get attention,  and I was informally consulted for an excellent report by the Center for New York City Affairs about the serious issues facing New York state’s algebra exams that eventually caught the attention of the New York Times. And I continued my work with the New York Times Learning Network, contributing math lessons on evaluating compulsory retirement savings plans and asking students “Why Do Americans Stink at Math?”

So a great year comes to an end, but here’s hoping 2016 is just as challenging, productive, and rewarding!

Related Posts

How Many Sides of a Pentagon Can You See?

Every fall, Math for America celebrates the great work of their math and science teachers with a gala dinner.  In addition to food, drinks, and talks from teachers, leaders, and policy makers, the event always features math puzzles to ponder while enjoying the evening’s festivities.

Pentagon Problem -- ColorHere is one of this year’s puzzles:

Suppose you are standing several miles from the Pentagon.  What is the probability you can see three sides of the building?

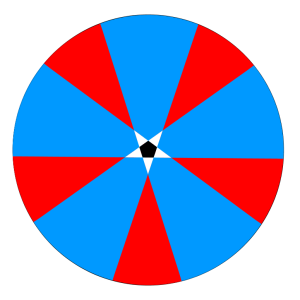
This is a fairly well-known puzzle with a seemingly straight-forward answer.  Consider the diagram at right.

The pentagon is shown in black, at the center.  Shown in white are the regions where only one side is visible; the regions where only two sides are visible are blue; and the regions where three sides are visible are red.

A simple “solution” is as follows.  An infinite red region is essentially equal in area to an infinite blue region, as they differ only by a finite amount: namely, the pentagon itself and three white triangles.  So from the perspective of the infinite plane, all finite regions are negligible, and the blue and red areas are equal.  Thus, there is a 50% chance you’ll see two sides, and a 50% chance you’ll see three sides.

This is the argument that some colleagues gave, and it is a nice one.  However, there’s a slight problem:  as stated, the puzzle didn’t suggest that the vantage point was a randomly selected point in the plane.  It suggested that the vantage point was a randomly selected point at a fixed distance from the pentagon!

At any finite distance from the pentagon, say D,  you are more likely to see two sides than three!  As D goes to infinity, the probabilities converge to one-half, but at any finite distance, the blue regions are always slightly larger than the red regions.

To illustrate this point, I created the following animation in Geogebra.  At small radii, the blue regions clearly occupy more area than the red regions, but as the radius increases, the respective areas start tend to converge.

So, not only was this a fun puzzle to think about,  but it became an object lesson in how important the statement of the problem can be.  And in particular, it’s a reminder of how the different ways we model random selection can make for big differences in our solutions!

Pentagon and Regions

Math Photo: Orthogonal Trajectories

Orthogonal Trajectories

This lovely photo was taken by mathematician Peter Krautzberger.  Peter knows that I enjoy photographing mathematics, so he shared this great image with me.  And he graciously let me share it here, and approved of the title.

I often admire crossing contrails high above in the sky, but I can’t say I’ve ever seen two so perpendicular!

Peter is a friend and colleague from MathBlogging.org, where he is a co-founder.  Peter also works on MathJax, and is consumed by publishing math on the web.  You can follow him on Twitter at @pkrautz.  Thank you, Peter, for sharing!


Follow

Get every new post delivered to your Inbox

Join other followers: